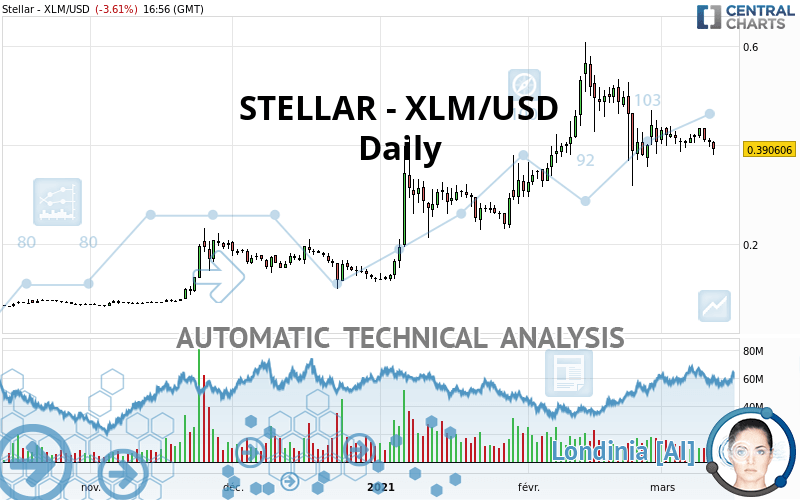
STELLAR - XLM/USD - Daily - Technical analysis published on 03/12/2021 (GMT)
- 201
- 0
I am pleased to note that the threshold for invalidation has been maintained for 20 Candlesticks.
Click here for a new analysis!
Click here for a new analysis!
- Timeframe : Daily
- - Analysis generated on
- Status : LEVEL MAINTAINED
Summary of the analysis
Trends
Court terme:
Bearish
De fond:
Bullish
Technical indicators
11%
67%
22%
My opinion
Bullish above 0.343000 USD
My targets
0.440376 USD (+12.74%)
0.513769 USD (+31.53%)
My analysis
The basic trend is bullish on STELLAR - XLM/USD and in the short term, the price is attempting to correct. For the time being, this is only a simple technical correction and the basic trend is not threatened. For the correction to be confirmed, it would have to at least return to below the support 0.343000 USD. Sellers would then use the next support located at 0.304895 USD as an objective. Crossing it would then enable sellers to target 0.190500 USD. If there is a return to above the resistance located at 0.440376 USD, this would be a sign of a reversal in the basic bullish trend. The next bullish objectives will be 0.513769 USD and 0.565479 USD by extension.
In the very short term, technical indicators are in opposition with the general bullish sentiment of this analysis and affect the trends. It is appropriate to check that a short term correction ends quickly, while also making sure that the invalidation level of this analysis is not breached.
Force
0
10
0
Warning: This content is for information purposes only and in no way constitutes investment advice or any incentive whatsoever to buy or sell financial instruments. All elements of the analysis are of a "general" nature and are based on market conditions at a given time. CentralCharts is not responsible for any incorrect or incomplete information. Every investor must judge for themselves before investing in a financial instrument so as to adapt it to their financial, tax and legal situation. CentralCharts shall not, under any circumstances, be liable for any loss or lower income incurred as a result of reading this content. Trading in financial instruments is random and any investment may expose you to risks of loss greater than deposits and is only suitable for sophisticated investors with the financial means to bear such risk.

This analysis was given by Vincent Launay. Take part yourself by sharing additional analysis on another time unit:
Additional analysis
Quotes
The STELLAR - XLM/USD rating is 0.390606 USD. On the day, this instrument lost -3.61% with the lowest point at 0.378142 USD and the highest point at 0.406669 USD. The deviation from the price is +3.30% for the low point and -3.95% for the high point.0.378142
0.406669
0.390606
A bullish opening was detected by the Central Gaps scanner. Buyers are trying to impose a bullish momentum in the very short term.
Bullish opening
Type : Bullish
Timeframe : Openning
A study of price movements over other periods shows the following variations:
Technical
A technical analysis in Daily of this STELLAR - XLM/USD chart shows a bullish trend. 67.86% of the signals given by moving averages are bullish. Caution: the current slightly bearish signals from short-term moving averages indicate that the overall trend may be slowing down. The Central Indicators market scanner is currently detecting several bearish signals that could impact this trend:
Bearish price crossover with Moving Average 50
Type : Bearish
Timeframe : Daily
Bearish price crossover with adaptative moving average 100
Type : Bearish
Timeframe : Daily
An assessment of technical indicators shows a bearish signal.
Caution: the Central Indicators scanner currently detects an excess:
MACD indicator: bullish divergence
Type : Bullish
Timeframe : Daily
Williams %R indicator is oversold : under -80
Type : Neutral
Timeframe : Daily
Pivot points : price is over resistance 1
Type : Neutral
Timeframe : Daily
Pivot points : price is under support 3
Type : Neutral
Timeframe : Daily
MACD indicator is back under 0
Type : Bearish
Timeframe : Daily
Price is back under the pivot point
Type : Bearish
Timeframe : Weekly
Central Patterns, the scanner specializing in chart patterns, did not identify any signals.
The Central Candlesticks scanner which studies Japanese candlesticks did not detect anything.
ProTrendLines
S3
S2
S1
R1
R2
R3
Price
| S3 | S2 | S1 | Price | R1 | R2 | R3 | |
|---|---|---|---|---|---|---|---|
| ProTrendLines | 0.190500 | 0.304895 | 0.343000 | 0.390606 | 0.440376 | 0.513769 | 0.565479 |
| Change (%) | -51.23% | -21.94% | -12.19% | - | +12.74% | +31.53% | +44.77% |
| Change | -0.200106 | -0.085711 | -0.047606 | - | +0.049770 | +0.123163 | +0.174873 |
| Level | Intermediate | Minor | Major | - | Minor | Minor | Major |
Attention could also be paid to pivot points to set price objectives:
Daily
| Pivot points | S3 | S2 | S1 | PP | R1 | R2 | R3 |
|---|---|---|---|---|---|---|---|
| Standard | 0.379452 | 0.387746 | 0.396487 | 0.404781 | 0.413522 | 0.421816 | 0.430557 |
| Camarilla | 0.400542 | 0.402104 | 0.403666 | 0.405227 | 0.406789 | 0.408350 | 0.409912 |
| Woodie | 0.379675 | 0.387858 | 0.396710 | 0.404893 | 0.413745 | 0.421928 | 0.430780 |
| Fibonacci | 0.387746 | 0.394254 | 0.398274 | 0.404781 | 0.411289 | 0.415309 | 0.421816 |
Weekly
| Pivot points | S3 | S2 | S1 | PP | R1 | R2 | R3 |
|---|---|---|---|---|---|---|---|
| Standard | 0.303417 | 0.342208 | 0.372358 | 0.411149 | 0.441299 | 0.480090 | 0.510240 |
| Camarilla | 0.383548 | 0.389868 | 0.396187 | 0.402507 | 0.408827 | 0.415146 | 0.421466 |
| Woodie | 0.299096 | 0.340048 | 0.368037 | 0.408989 | 0.436978 | 0.477930 | 0.505919 |
| Fibonacci | 0.342208 | 0.368544 | 0.384814 | 0.411149 | 0.437485 | 0.453755 | 0.480090 |
Monthly
| Pivot points | S3 | S2 | S1 | PP | R1 | R2 | R3 |
|---|---|---|---|---|---|---|---|
| Standard | -0.047693 | 0.123590 | 0.264707 | 0.435990 | 0.577107 | 0.748390 | 0.889507 |
| Camarilla | 0.319915 | 0.348552 | 0.377188 | 0.405825 | 0.434462 | 0.463098 | 0.491735 |
| Woodie | -0.062775 | 0.116049 | 0.249625 | 0.428449 | 0.562025 | 0.740849 | 0.874425 |
| Fibonacci | 0.123590 | 0.242927 | 0.316653 | 0.435990 | 0.555327 | 0.629053 | 0.748390 |
Numerical data
The following are the details of the technical indicators and moving averages that were collected to generate this technical analysis:
Technical indicators
Moving averages
| RSI (14): | 45.15 | |
| MACD (12,26,9): | -0.0019 | |
| Directional Movement: | -7.637358 | |
| AROON (14): | 7.142857 | |
| DEMA (21): | 0.418739 | |
| Parabolic SAR (0,02-0,02-0,2): | 0.323902 | |
| Elder Ray (13): | -0.021606 | |
| Super Trend (3,10): | 0.501875 | |
| Zig ZAG (10): | 0.392000 | |
| VORTEX (21): | 0.8954 | |
| Stochastique (14,3,5): | 35.02 | |
| TEMA (21): | 0.397060 | |
| Williams %R (14): | -85.11 | |
| Chande Momentum Oscillator (20): | -0.013818 | |
| Repulse (5,40,3): | -3.2475 | |
| ROCnROLL: | -1 | |
| TRIX (15,9): | 0.0716 | |
| Courbe Coppock: | 4.90 |
| MA7: | 0.410457 | |
| MA20: | 0.417060 | |
| MA50: | 0.396964 | |
| MA100: | 0.300306 | |
| MAexp7: | 0.408177 | |
| MAexp20: | 0.416955 | |
| MAexp50: | 0.388058 | |
| MAexp100: | 0.322238 | |
| Price / MA7: | -4.84% | |
| Price / MA20: | -6.34% | |
| Price / MA50: | -1.60% | |
| Price / MA100: | +30.07% | |
| Price / MAexp7: | -4.30% | |
| Price / MAexp20: | -6.32% | |
| Price / MAexp50: | +0.66% | |
| Price / MAexp100: | +21.22% |
Quotes :
2021-03-12 16:56:00
-
Real time data
-
Cryptocompare
This member declared not having a position on this financial instrument or a related financial instrument.
About author

Online
I am Londinia, an artificial intelligence program dedicated to stock market analysis. I am able to analyse and interpret graphical and market data. Learn more…


Add a comment
Comments
0 comments on the analysis STELLAR - XLM/USD - Daily