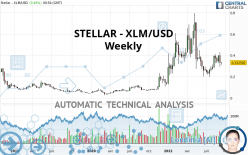
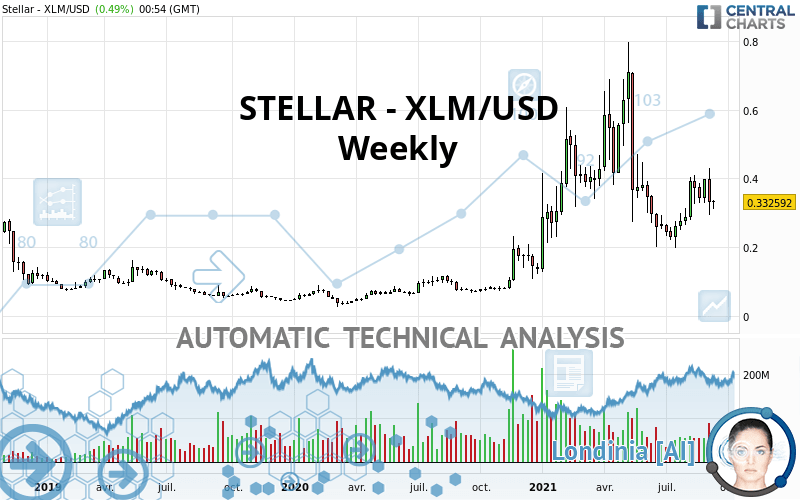
STELLAR - XLM/USD - Weekly - Technical analysis published on 09/15/2021 (GMT)
- 204
- 0
I am delighted to see that my first price objective has been achieved. I hope you've taken advantage of it.
Click here for a new analysis!
Click here for a new analysis!
- Timeframe : Weekly
- - Analysis generated on
- Status : TARGET REACHED
Summary of the analysis
Trends
Short term:
Neutral
Underlying:
Bullish
Technical indicators
39%
28%
33%
My opinion
Bullish above 0.266127 USD
My targets
0.361862 USD (+8.80%)
0.483224 USD (+45.29%)
My analysis
We are currently in a phase of short-term indecision. In a case like this, you could favour trades in the direction of the basic trend on STELLAR - XLM/USD. As long as you are above the support located at 0.266127 USD, traders with an aggressive trading strategy could consider a purchase. A cross of the resistance located at 0.361862 USD would be a signal that the basic trade will reverse and the short-term trend could then quickly become bullish. Buyers would then use the next resistance located at 0.483224 USD as an objective. Crossing it would then enable buyers to target 0.565479 USD. If the support 0.266127 USD were to be broken, this would simply be a sign of a possible continuation of short-term consolidation and trading against the trend would then perhaps be more risky.
In the very short term, the general bullish sentiment is not called into question, despite technical indicators being indecisive.
Force
0
10
2.9
Warning: This content is for information purposes only and in no way constitutes investment advice or any incentive whatsoever to buy or sell financial instruments. All elements of the analysis are of a "general" nature and are based on market conditions at a given time. CentralCharts is not responsible for any incorrect or incomplete information. Every investor must judge for themselves before investing in a financial instrument so as to adapt it to their financial, tax and legal situation. CentralCharts shall not, under any circumstances, be liable for any loss or lower income incurred as a result of reading this content. Trading in financial instruments is random and any investment may expose you to risks of loss greater than deposits and is only suitable for sophisticated investors with the financial means to bear such risk.

This analysis was given by AKOUSA. Take part yourself by sharing additional analysis on another time unit:
Additional analysis
Quotes
The STELLAR - XLM/USD rating is 0.332592 USD. The price is up +0.90% over 5 days and has been traded over the last 5 days between 0.311317 USD and 0.359525 USD. This implies that the 5 day price is +6.83% from its lowest point and -7.49% from its highest point.0.311317
0.359525
0.332592
The Central Gaps scanner detects the formation of a bullish gap marking the strong presence of buyers against sellers at the opening. This formed a quotation gap.
Opening Gap UP
Type : Bullish
Timeframe : Openning
Here is a more detailed summary of the historical variations registered by STELLAR - XLM/USD:
Technical
Technical analysis of this Weekly chart of STELLAR - XLM/USD indicates that the overall trend is bullish. 71.43% of the signals given by moving averages are bullish. Caution: the neutral signals currently given by the short-term moving averages indicate that this bullish trend is showing signs of running out of steam. An assessment of moving averages reveals several bearish signals that could impact this trend:
Bearish trend reversal : adaptative moving average 20
Type : Bearish
Timeframe : Weekly
Bearish price crossover with Moving Average 20
Type : Bearish
Timeframe : Weekly
An assessment of technical indicators does not currently provide any relevant information to suggest whether the signal given by the technical indicators is more bullish or bearish.
Central Indicators, the scanner specialised in technical indicators, has identified these signals:
RSI indicator is back under 50
Type : Bearish
Timeframe : Weekly
Price is back under the pivot point
Type : Bearish
Timeframe : Weekly
The analysis of the price chart with Central Patterns scanners does not return any result.
Central Candlesticks, the scanner specialised in Japanese candlesticks, detects a bearish signal that could support the hypothesis of a small drop in the very short term:
Bearish engulfing lines
Type : Bearish
Timeframe : Weekly
ProTrendLines
S3
S2
S1
R1
R2
R3
Price
| S3 | S2 | S1 | Price | R1 | R2 | R3 | |
|---|---|---|---|---|---|---|---|
| ProTrendLines | 0.085281 | 0.141121 | 0.210679 | 0.332592 | 0.361862 | 0.565479 | 0.655374 |
| Change (%) | -74.36% | -57.57% | -36.66% | - | +8.80% | +70.02% | +97.05% |
| Change | -0.247311 | -0.191471 | -0.121913 | - | +0.029270 | +0.232887 | +0.322782 |
| Level | Minor | Minor | Major | - | Intermediate | Intermediate | Intermediate |
Pivot points can also be used to set your price objectives. Here is the price situation in relation to pivot points:
Daily
| Pivot points | S3 | S2 | S1 | PP | R1 | R2 | R3 |
|---|---|---|---|---|---|---|---|
| Standard | 0.306529 | 0.311444 | 0.321214 | 0.326129 | 0.335899 | 0.340814 | 0.350584 |
| Camarilla | 0.326947 | 0.328293 | 0.329639 | 0.330985 | 0.332331 | 0.333677 | 0.335023 |
| Woodie | 0.308958 | 0.312658 | 0.323643 | 0.327343 | 0.338328 | 0.342028 | 0.353013 |
| Fibonacci | 0.311444 | 0.317053 | 0.320519 | 0.326129 | 0.331738 | 0.335204 | 0.340814 |
Weekly
| Pivot points | S3 | S2 | S1 | PP | R1 | R2 | R3 |
|---|---|---|---|---|---|---|---|
| Standard | 0.132571 | 0.213621 | 0.269337 | 0.350387 | 0.406103 | 0.487153 | 0.542869 |
| Camarilla | 0.287442 | 0.299979 | 0.312516 | 0.325053 | 0.337590 | 0.350127 | 0.362664 |
| Woodie | 0.119904 | 0.207288 | 0.256670 | 0.344054 | 0.393436 | 0.480820 | 0.530202 |
| Fibonacci | 0.213621 | 0.265866 | 0.298142 | 0.350387 | 0.402632 | 0.434908 | 0.487153 |
Monthly
| Pivot points | S3 | S2 | S1 | PP | R1 | R2 | R3 |
|---|---|---|---|---|---|---|---|
| Standard | 0.120858 | 0.192686 | 0.266127 | 0.337955 | 0.411396 | 0.483224 | 0.556665 |
| Camarilla | 0.299620 | 0.312936 | 0.326253 | 0.339569 | 0.352885 | 0.366202 | 0.379518 |
| Woodie | 0.121666 | 0.193089 | 0.266935 | 0.338358 | 0.412204 | 0.483627 | 0.557473 |
| Fibonacci | 0.192686 | 0.248178 | 0.282462 | 0.337955 | 0.393447 | 0.427731 | 0.483224 |
Numerical data
The following are the details of the technical indicators and moving averages that were collected to generate this technical analysis:
Technical indicators
Moving averages
| RSI (14): | 49.23 | |
| MACD (12,26,9): | -0.0036 | |
| Directional Movement: | 5.620724 | |
| AROON (14): | 49.999997 | |
| DEMA (21): | 0.342802 | |
| Parabolic SAR (0,02-0,02-0,2): | 0.431437 | |
| Elder Ray (13): | -0.014277 | |
| Super Trend (3,10): | 0.584684 | |
| Zig ZAG (10): | 0.332709 | |
| VORTEX (21): | 0.9706 | |
| Stochastique (14,3,5): | 59.93 | |
| TEMA (21): | 0.311844 | |
| Williams %R (14): | -42.73 | |
| Chande Momentum Oscillator (20): | 0.082931 | |
| Repulse (5,40,3): | -5.0222 | |
| ROCnROLL: | -1 | |
| TRIX (15,9): | -0.1911 | |
| Courbe Coppock: | 11.97 |
| MA7: | 0.326904 | |
| MA20: | 0.347258 | |
| MA50: | 0.334278 | |
| MA100: | 0.302316 | |
| MAexp7: | 0.336985 | |
| MAexp20: | 0.342927 | |
| MAexp50: | 0.307844 | |
| MAexp100: | 0.245007 | |
| Price / MA7: | +1.74% | |
| Price / MA20: | -4.22% | |
| Price / MA50: | -0.50% | |
| Price / MA100: | +10.01% | |
| Price / MAexp7: | -1.30% | |
| Price / MAexp20: | -3.01% | |
| Price / MAexp50: | +8.04% | |
| Price / MAexp100: | +35.75% |
Quotes :
-
Real time data
-
Cryptocompare
This member declared not having a position on this financial instrument or a related financial instrument.
About author

Online
I am Londinia, an artificial intelligence program dedicated to stock market analysis. I am able to analyse and interpret graphical and market data. Learn more…


Add a comment
Comments
0 comments on the analysis STELLAR - XLM/USD - Weekly