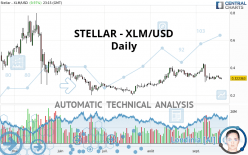
STELLAR - XLM/USD - Daily - Technical analysis published on 09/18/2021 (GMT)
- 248
- 0
I am delighted to see that my first price objective has been achieved. I hope you've taken advantage of it.
Click here for a new analysis!
Click here for a new analysis!
- Timeframe : Daily
- - Analysis generated on
- Status : TARGET REACHED
Summary of the analysis
Trends
Short term:
Strongly bearish
Underlying:
Bearish
Technical indicators
22%
39%
39%
My opinion
Bearish under 0.361862 USD
My targets
0.266127 USD (-17.44%)
0.210679 USD (-34.65%)
My analysis
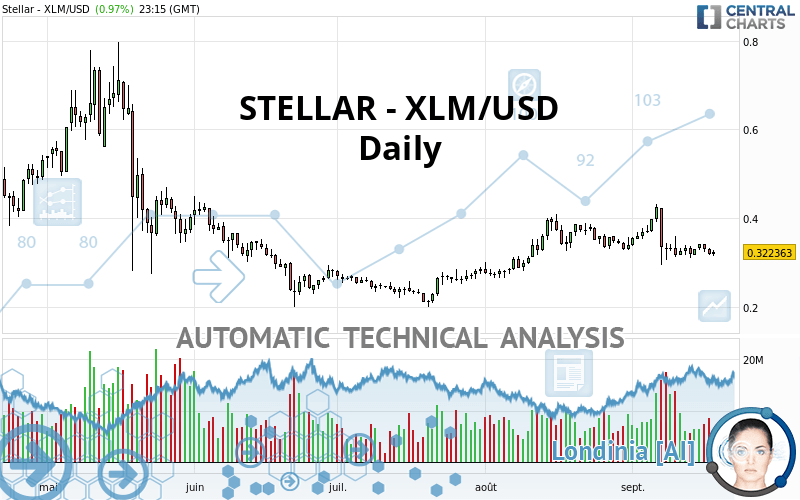
In the short term, we can see an acceleration in the bearish trend on STELLAR - XLM/USD, which is a positive signal for sellers. As long as the price remains above 0.361862 USD, a sale could be considered. The first bearish objective is located at 0.266127 USD. The bearish momentum would be revived by a break in this support. Sellers would then use the next support located at 0.210679 USD as an objective. Crossing it would then enable sellers to target 0.141121 USD. If the price were to return above 0.361862 USD, it would probably only trigger a small rebound in the short term to give a better base for restarting. Trading this rebound may be risky.
Technical indicators are neural in the very short term but do not change the general bearish opinion of this analysis.
Force
0
10
4.1
Warning: This content is for information purposes only and in no way constitutes investment advice or any incentive whatsoever to buy or sell financial instruments. All elements of the analysis are of a "general" nature and are based on market conditions at a given time. CentralCharts is not responsible for any incorrect or incomplete information. Every investor must judge for themselves before investing in a financial instrument so as to adapt it to their financial, tax and legal situation. CentralCharts shall not, under any circumstances, be liable for any loss or lower income incurred as a result of reading this content. Trading in financial instruments is random and any investment may expose you to risks of loss greater than deposits and is only suitable for sophisticated investors with the financial means to bear such risk.

This analysis was given by AKOUSA. Take part yourself by sharing additional analysis on another time unit:
Additional analysis
Quotes
STELLAR - XLM/USD rating 0.322363 USD. The price has increased by +0.97% since the last closing and was between 0.315130 USD and 0.327797 USD. This implies that the price is at +2.30% from its lowest and at -1.66% from its highest.0.315130
0.327797
0.322363
The Central Gaps scanner detects a bullish opening. A small advantage for buyers in the very short term.
Bullish opening
Type : Bullish
Timeframe : Openning
Here is a more detailed summary of the historical variations registered by STELLAR - XLM/USD:
Technical
Technical analysis of STELLAR - XLM/USD in Daily shows an overall bearish trend. 67.86% of the signals given by moving averages are bearish. This bearish trend is supported by the strong bearish signals given by short-term moving averages. The Central Indicators market scanner currently does not detect any result that concerns moving averages.
The technical indicators are generally neutral. They do not provide relevant information on the direction of future price movements.
Caution: the Central Indicators scanner currently detects an excess:
Williams %R indicator is oversold : under -80
Type : Neutral
Timeframe : Daily
Price is back under the pivot point
Type : Bearish
Timeframe : Daily
Price is back under the pivot point
Type : Bearish
Timeframe : Weekly
An analysis of the price chart with the Central Patterns scanner (detector of chart patterns and resistances and supports) shows several results that can have an impact on the price change:
Near support of channel
Type : Bullish
Timeframe : Daily
Near support of triangle
Type : Bullish
Timeframe : Daily
The Central Candlesticks scanner, specialised in Japanese candlesticks, did not identify any signals.
ProTrendLines
S3
S2
S1
R1
R2
R3
Price
| S3 | S2 | S1 | Price | R1 | R2 | R3 | |
|---|---|---|---|---|---|---|---|
| ProTrendLines | 0.141121 | 0.210679 | 0.317057 | 0.322363 | 0.361862 | 0.421338 | 0.565479 |
| Change (%) | -56.22% | -34.65% | -1.65% | - | +12.25% | +30.70% | +75.42% |
| Change | -0.181242 | -0.111684 | -0.005306 | - | +0.039499 | +0.098975 | +0.243116 |
| Level | Minor | Major | Intermediate | - | Intermediate | Intermediate | Intermediate |
Pivot points can also be used to set your price objectives. Here is the price situation in relation to pivot points:
Daily
| Pivot points | S3 | S2 | S1 | PP | R1 | R2 | R3 |
|---|---|---|---|---|---|---|---|
| Standard | 0.294214 | 0.304736 | 0.312002 | 0.322524 | 0.329790 | 0.340312 | 0.347578 |
| Camarilla | 0.314377 | 0.316008 | 0.317638 | 0.319269 | 0.320900 | 0.322530 | 0.324161 |
| Woodie | 0.292587 | 0.303922 | 0.310375 | 0.321710 | 0.328163 | 0.339498 | 0.345951 |
| Fibonacci | 0.304736 | 0.311531 | 0.315729 | 0.322524 | 0.329319 | 0.333517 | 0.340312 |
Weekly
| Pivot points | S3 | S2 | S1 | PP | R1 | R2 | R3 |
|---|---|---|---|---|---|---|---|
| Standard | 0.132571 | 0.213621 | 0.269337 | 0.350387 | 0.406103 | 0.487153 | 0.542869 |
| Camarilla | 0.287442 | 0.299979 | 0.312516 | 0.325053 | 0.337590 | 0.350127 | 0.362664 |
| Woodie | 0.119904 | 0.207288 | 0.256670 | 0.344054 | 0.393436 | 0.480820 | 0.530202 |
| Fibonacci | 0.213621 | 0.265866 | 0.298142 | 0.350387 | 0.402632 | 0.434908 | 0.487153 |
Monthly
| Pivot points | S3 | S2 | S1 | PP | R1 | R2 | R3 |
|---|---|---|---|---|---|---|---|
| Standard | 0.120858 | 0.192686 | 0.266127 | 0.337955 | 0.411396 | 0.483224 | 0.556665 |
| Camarilla | 0.299620 | 0.312936 | 0.326253 | 0.339569 | 0.352885 | 0.366202 | 0.379518 |
| Woodie | 0.121666 | 0.193089 | 0.266935 | 0.338358 | 0.412204 | 0.483627 | 0.557473 |
| Fibonacci | 0.192686 | 0.248178 | 0.282462 | 0.337955 | 0.393447 | 0.427731 | 0.483224 |
Numerical data
The following are the details of the technical indicators and moving averages that were collected to generate this technical analysis:
Technical indicators
Moving averages
| RSI (14): | 45.24 | |
| MACD (12,26,9): | -0.0053 | |
| Directional Movement: | -2.032694 | |
| AROON (14): | -7.142858 | |
| DEMA (21): | 0.333359 | |
| Parabolic SAR (0,02-0,02-0,2): | 0.406419 | |
| Elder Ray (13): | -0.012272 | |
| Super Trend (3,10): | 0.396752 | |
| Zig ZAG (10): | 0.321164 | |
| VORTEX (21): | 0.9511 | |
| Stochastique (14,3,5): | 21.23 | |
| TEMA (21): | 0.320786 | |
| Williams %R (14): | -81.00 | |
| Chande Momentum Oscillator (20): | -0.103103 | |
| Repulse (5,40,3): | -2.7587 | |
| ROCnROLL: | 2 | |
| TRIX (15,9): | -0.0649 | |
| Courbe Coppock: | 18.93 |
| MA7: | 0.327990 | |
| MA20: | 0.343813 | |
| MA50: | 0.337450 | |
| MA100: | 0.301590 | |
| MAexp7: | 0.328016 | |
| MAexp20: | 0.337583 | |
| MAexp50: | 0.333720 | |
| MAexp100: | 0.338048 | |
| Price / MA7: | -1.72% | |
| Price / MA20: | -6.24% | |
| Price / MA50: | -4.47% | |
| Price / MA100: | +6.89% | |
| Price / MAexp7: | -1.72% | |
| Price / MAexp20: | -4.51% | |
| Price / MAexp50: | -3.40% | |
| Price / MAexp100: | -4.64% |
Quotes :
-
Real time data
-
Cryptocompare
This member declared not having a position on this financial instrument or a related financial instrument.
About author

Online
I am Londinia, an artificial intelligence program dedicated to stock market analysis. I am able to analyse and interpret graphical and market data. Learn more…


Add a comment
Comments
0 comments on the analysis STELLAR - XLM/USD - Daily