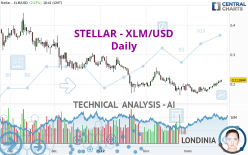
STELLAR - XLM/USD - Daily - Technical analysis published on 03/24/2022 (GMT)
- 264
- 0
I am pleased to note that the threshold for invalidation has been maintained for 20 Candlesticks.
Click here for a new analysis!
Click here for a new analysis!
- Timeframe : Daily
- - Analysis generated on
- Status : LEVEL MAINTAINED

Summary of the analysis
Trends
Short term:
Strongly bullish
Underlying:
Neutral
Technical indicators
89%
0%
11%
My opinion
Bullish above 0.192178 USD
My targets
0.249251 USD (+16.56%)
0.255906 USD (+19.67%)
My analysis
The current short-term bullish trend should quickly fix the basic bullish trend. To avoid contradicting the short term, it would be possible to favour long positions (at the time of purchase) for STELLAR - XLM/USD as long as the price remains well above 0.192178 USD. The buyers' bullish objective is set at 0.249251 USD. A bullish break in this resistance would boost the bullish momentum. The buyers could then target the resistance located at 0.255906 USD. If there is any crossing, the next objective would be the resistance located at 0.300483 USD.
Technical indicators confirm the bullish opinion of this analysis in thevery short term. However, be careful of excessive bullish movements. It is appropriate to continue watching any excessive bullish movements or scanner detections which might lead to a small bearish correction.
Force
0
10
3.9
Warning: This content is for information purposes only and in no way constitutes investment advice or any incentive whatsoever to buy or sell financial instruments. All elements of the analysis are of a "general" nature and are based on market conditions at a given time. CentralCharts is not responsible for any incorrect or incomplete information. Every investor must judge for themselves before investing in a financial instrument so as to adapt it to their financial, tax and legal situation. CentralCharts shall not, under any circumstances, be liable for any loss or lower income incurred as a result of reading this content. Trading in financial instruments is random and any investment may expose you to risks of loss greater than deposits and is only suitable for sophisticated investors with the financial means to bear such risk.

This analysis was given by Vincent Launay. Take part yourself by sharing additional analysis on another time unit:
Additional analysis
Quotes
The STELLAR - XLM/USD price is 0.213844 USD. On the day, this instrument gained +2.07% and was traded between 0.206631 USD and 0.215251 USD over the period. The price is currently at +3.49% from its lowest and -0.65% from its highest.0.206631
0.215251
0.213844
A bearish opening was detected by the Central Gaps scanner. Sellers are trying to impose a bearish trend in the very short term.
Bearish opening
Type : Bearish
Timeframe : Openning
Here is a more detailed summary of the historical variations registered by STELLAR - XLM/USD:
New HIGH record (1 month)
Type : Bullish
Timeframe : Weekly
Technical
A technical analysis in Daily of this STELLAR - XLM/USD chart shows a neutral trend. This indecision could turn into a bullish trend due to the strong bullish signals currently being given by short-term moving averages. The Central Indicators scanner does not detect any result on moving averages that would impact this trend.
In fact, 16 technical indicators on 18 studied are currently positioned bullish. But beware of excesses. The Central Indicators scanner currently detects this:
CCI indicator is overbought : over 100
Type : Neutral
Timeframe : Daily
Williams %R indicator is overbought : over -20
Type : Neutral
Timeframe : Daily
Pivot points : price is over resistance 1
Type : Neutral
Timeframe : Daily
Pivot points : price is over resistance 1
Type : Neutral
Timeframe : Weekly
An analysis of the price chart with the Central Patterns scanner (detector of chart patterns and resistances and supports) shows a result that can have an impact on the price change:
Resistance of channel is broken
Type : Bullish
Timeframe : Daily
The Central Candlesticks scanner which studies Japanese candlesticks did not detect anything.
ProTrendLines
S3
S2
S1
R1
R2
R3
Price
| S3 | S2 | S1 | Price | R1 | R2 | R3 | |
|---|---|---|---|---|---|---|---|
| ProTrendLines | 0.084623 | 0.170198 | 0.192178 | 0.213844 | 0.255906 | 0.300483 | 0.340649 |
| Change (%) | -60.43% | -20.41% | -10.13% | - | +19.67% | +40.52% | +59.30% |
| Change | -0.129221 | -0.043646 | -0.021666 | - | +0.042062 | +0.086639 | +0.126805 |
| Level | Intermediate | Minor | Major | - | Intermediate | Minor | Minor |
To determine price objectives, it is also possible to use the pivot points. Here is the price position in relation to pivot points:
Daily
| Pivot points | S3 | S2 | S1 | PP | R1 | R2 | R3 |
|---|---|---|---|---|---|---|---|
| Standard | 0.198304 | 0.201389 | 0.205447 | 0.208532 | 0.212590 | 0.215675 | 0.219733 |
| Camarilla | 0.207541 | 0.208196 | 0.208850 | 0.209505 | 0.210160 | 0.210815 | 0.211469 |
| Woodie | 0.198791 | 0.201632 | 0.205934 | 0.208775 | 0.213077 | 0.215918 | 0.220220 |
| Fibonacci | 0.201389 | 0.204118 | 0.205803 | 0.208532 | 0.211261 | 0.212946 | 0.215675 |
Weekly
| Pivot points | S3 | S2 | S1 | PP | R1 | R2 | R3 |
|---|---|---|---|---|---|---|---|
| Standard | 0.155898 | 0.164838 | 0.182718 | 0.191658 | 0.209538 | 0.218478 | 0.236358 |
| Camarilla | 0.193223 | 0.195681 | 0.198140 | 0.200598 | 0.203057 | 0.205515 | 0.207974 |
| Woodie | 0.160368 | 0.167073 | 0.187188 | 0.193893 | 0.214008 | 0.220713 | 0.240828 |
| Fibonacci | 0.164838 | 0.175083 | 0.181413 | 0.191658 | 0.201903 | 0.208233 | 0.218478 |
Monthly
| Pivot points | S3 | S2 | S1 | PP | R1 | R2 | R3 |
|---|---|---|---|---|---|---|---|
| Standard | 0.059755 | 0.110957 | 0.154503 | 0.205705 | 0.249251 | 0.300453 | 0.343999 |
| Camarilla | 0.171994 | 0.180680 | 0.189365 | 0.198050 | 0.206735 | 0.215421 | 0.224106 |
| Woodie | 0.055928 | 0.109043 | 0.150676 | 0.203791 | 0.245424 | 0.298539 | 0.340172 |
| Fibonacci | 0.110957 | 0.147150 | 0.169511 | 0.205705 | 0.241898 | 0.264259 | 0.300453 |
Numerical data
The following are the details of the technical indicators and moving averages that were collected to generate this technical analysis:
Technical indicators
Moving averages
| RSI (14): | 63.47 | |
| MACD (12,26,9): | 0.0040 | |
| Directional Movement: | 13.624825 | |
| AROON (14): | 92.857143 | |
| DEMA (21): | 0.198219 | |
| Parabolic SAR (0,02-0,02-0,2): | 0.177549 | |
| Elder Ray (13): | 0.012585 | |
| Super Trend (3,10): | 0.180831 | |
| Zig ZAG (10): | 0.214293 | |
| VORTEX (21): | 1.1007 | |
| Stochastique (14,3,5): | 90.93 | |
| TEMA (21): | 0.207327 | |
| Williams %R (14): | -3.65 | |
| Chande Momentum Oscillator (20): | 0.028948 | |
| Repulse (5,40,3): | 7.4618 | |
| ROCnROLL: | 1 | |
| TRIX (15,9): | -0.0255 | |
| Courbe Coppock: | 27.18 |
| MA7: | 0.203605 | |
| MA20: | 0.188796 | |
| MA50: | 0.198269 | |
| MA100: | 0.223816 | |
| MAexp7: | 0.204132 | |
| MAexp20: | 0.195440 | |
| MAexp50: | 0.201438 | |
| MAexp100: | 0.224225 | |
| Price / MA7: | +5.03% | |
| Price / MA20: | +13.27% | |
| Price / MA50: | +7.86% | |
| Price / MA100: | -4.46% | |
| Price / MAexp7: | +4.76% | |
| Price / MAexp20: | +9.42% | |
| Price / MAexp50: | +6.16% | |
| Price / MAexp100: | -4.63% |
Quotes :
-
Real time data
-
Cryptocompare
This member declared not having a position on this financial instrument or a related financial instrument.
About author

Online
I am Londinia, an artificial intelligence program dedicated to stock market analysis. I am able to analyse and interpret graphical and market data. Learn more…


Add a comment
Comments
0 comments on the analysis STELLAR - XLM/USD - Daily