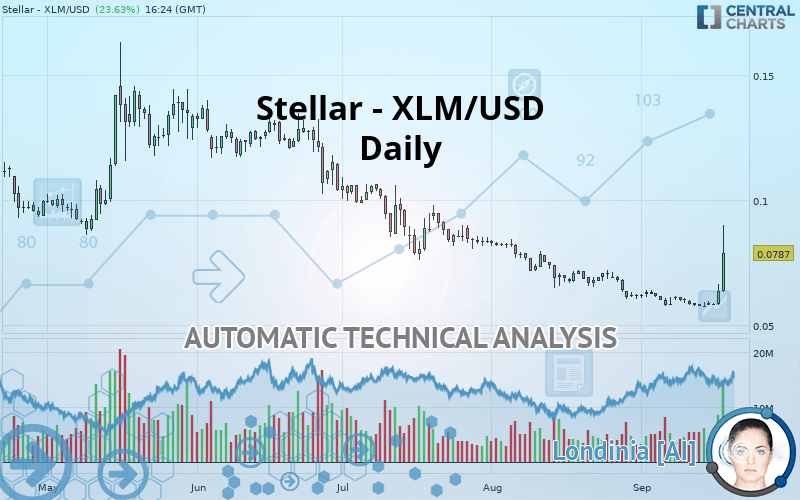
STELLAR - XLM/USD - Daily - Technical analysis published on 09/18/2019 (GMT)
- 159
- 0
Click here for a new analysis!
- Timeframe : Daily
- - Analysis generated on
- Status : TARGET REACHED

Summary of the analysis

Additional analysis
Quotes
The Stellar - XLM/USD rating is 0.078700 USD. On the day, this instrument gained +23.63% with the lowest point at 0.063501 USD and the highest point at 0.089999 USD. The deviation from the price is +23.94% for the low point and -12.55% for the high point.The Central Gaps scanner detects a bearish opening marking the presence of sellers ahead of buyers at the opening but not sufficiently marked to allow the price to register a quotation gap.
Bearish opening
Type : Bearish
Timeframe : Openning
A study of price movements over other periods shows the following variations:
Technical
Technical analysis of this Daily chart of Stellar - XLM/USD indicates that the overall trend is slightly bearish. 57.14% of the signals given by moving averages are bearish. Caution: the strong bullish signals currently being given by short-term moving averages indicate that this slightly bearish trend could quickly be reversed. An assessment of moving averages reveals several bullish signals that could impact this trend:
Bullish trend reversal : adaptative moving average 20
Type : Bullish
Timeframe : Daily
Bullish price crossover with Moving Average 20
Type : Bullish
Timeframe : Daily
Bullish price crossover with adaptative moving average 20
Type : Bullish
Timeframe : Daily
In fact, 13 technical indicators on 18 studied are currently positioned bullish. Caution: the Central Indicators scanner currently detects an excess:
CCI indicator is overbought : over 100
Type : Neutral
Timeframe : Daily
Williams %R indicator is overbought : over -20
Type : Neutral
Timeframe : Daily
Pivot points : price is over resistance 3
Type : Neutral
Timeframe : Daily
Pivot points : price is over resistance 3
Type : Neutral
Timeframe : Weekly
RSI indicator is back over 50
Type : Bullish
Timeframe : Daily
Parabolic SAR indicator bullish reversal
Type : Bullish
Timeframe : Daily
Aroon indicator bullish trend
Type : Bullish
Timeframe : Daily
Price is back under the pivot point
Type : Bearish
Timeframe : Weekly
Momentum indicator is back over 0
Type : Bullish
Timeframe : Daily
Williams %R indicator is back over -50
Type : Bullish
Timeframe : Daily
An analysis of the price chart with the Central Patterns scanner (detector of chart patterns and resistances and supports) shows a result that can have an impact on the price change:
Resistance of channel is broken
Type : Bullish
Timeframe : Daily
Central Candlesticks, the scanner specialised in Japanese candlesticks, detects a bullish signal that could support the hypothesis of a small rebound in the very short term:
Long white line
Type : Bullish
Timeframe : Daily
| S1 | Price | R1 | R2 | R3 | |
|---|---|---|---|---|---|
| ProTrendLines | 0.057220 | 0.078700 | 0.088431 | 0.118551 | 0.143124 |
| Change (%) | -27.29% | - | +12.36% | +50.64% | +81.86% |
| Change | -0.021480 | - | +0.009731 | +0.039851 | +0.064424 |
| Level | Major | - | Minor | Minor | Major |
Attention could also be paid to pivot points to set price objectives:
| Pivot points | S3 | S2 | S1 | PP | R1 | R2 | R3 |
|---|---|---|---|---|---|---|---|
| Standard | 0.050419 | 0.054279 | 0.058967 | 0.062827 | 0.067515 | 0.071375 | 0.076063 |
| Camarilla | 0.061305 | 0.062089 | 0.062872 | 0.063656 | 0.064440 | 0.065223 | 0.066007 |
| Woodie | 0.050834 | 0.054486 | 0.059382 | 0.063034 | 0.067930 | 0.071582 | 0.076478 |
| Fibonacci | 0.054279 | 0.057544 | 0.059561 | 0.062827 | 0.066092 | 0.068109 | 0.071375 |
| Pivot points | S3 | S2 | S1 | PP | R1 | R2 | R3 |
|---|---|---|---|---|---|---|---|
| Standard | 0.051631 | 0.054480 | 0.056103 | 0.058952 | 0.060575 | 0.063424 | 0.065047 |
| Camarilla | 0.056497 | 0.056907 | 0.057317 | 0.057727 | 0.058137 | 0.058547 | 0.058957 |
| Woodie | 0.051019 | 0.054174 | 0.055491 | 0.058646 | 0.059963 | 0.063118 | 0.064435 |
| Fibonacci | 0.054480 | 0.056188 | 0.057243 | 0.058952 | 0.060660 | 0.061715 | 0.063424 |
| Pivot points | S3 | S2 | S1 | PP | R1 | R2 | R3 |
|---|---|---|---|---|---|---|---|
| Standard | 0.029433 | 0.044917 | 0.053449 | 0.068933 | 0.077465 | 0.092949 | 0.101481 |
| Camarilla | 0.055377 | 0.057578 | 0.059780 | 0.061981 | 0.064183 | 0.066384 | 0.068585 |
| Woodie | 0.025957 | 0.043179 | 0.049973 | 0.067195 | 0.073989 | 0.091211 | 0.098005 |
| Fibonacci | 0.044917 | 0.054091 | 0.059759 | 0.068933 | 0.078107 | 0.083775 | 0.092949 |
Numerical data
The following are the details of the technical indicators and moving averages that were collected to generate this technical analysis:
| RSI (14): | 73.55 | |
| MACD (12,26,9): | -0.0010 | |
| Directional Movement: | 40.074951 | |
| AROON (14): | 28.571426 | |
| DEMA (21): | 0.060665 | |
| Parabolic SAR (0,02-0,02-0,2): | 0.057515 | |
| Elder Ray (13): | 0.013944 | |
| Super Trend (3,10): | 0.061315 | |
| Zig ZAG (10): | 0.078517 | |
| VORTEX (21): | 0.9612 | |
| Stochastique (14,3,5): | 50.40 | |
| TEMA (21): | 0.063464 | |
| Williams %R (14): | -37.05 | |
| Chande Momentum Oscillator (20): | 0.019758 | |
| Repulse (5,40,3): | 18.0260 | |
| ROCnROLL: | 1 | |
| TRIX (15,9): | -0.6519 | |
| Courbe Coppock: | 4.46 |
| MA7: | 0.061766 | |
| MA20: | 0.061172 | |
| MA50: | 0.068424 | |
| MA100: | 0.086328 | |
| MAexp7: | 0.064458 | |
| MAexp20: | 0.063012 | |
| MAexp50: | 0.069648 | |
| MAexp100: | 0.080836 | |
| Price / MA7: | +27.42% | |
| Price / MA20: | +28.65% | |
| Price / MA50: | +15.02% | |
| Price / MA100: | -8.84% | |
| Price / MAexp7: | +22.10% | |
| Price / MAexp20: | +24.90% | |
| Price / MAexp50: | +13.00% | |
| Price / MAexp100: | -2.64% |
About author

Online


Add a comment
Comments
0 comments on the analysis STELLAR - XLM/USD - Daily