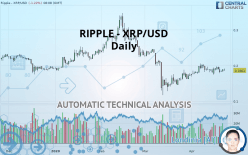
RIPPLE - XRP/USD - Daily - Technical analysis published on 04/23/2020 (GMT)
- Who voted?
- 227
- 0
Click here for a new analysis!
- Timeframe : Daily
- - Analysis generated on
- Status : INVALID

Summary of the analysis

Additional analysis
Quotes
The RIPPLE - XRP/USD rating is 0.186100 USD. The price is lower by -1.22% since the last closing and was traded between 0.185800 USD and 0.191200 USD over the period. The price is currently at +0.16% from its lowest and -2.67% from its highest.The Central Gaps scanner detects a bearish opening marking the presence of sellers ahead of buyers at the opening but not sufficiently marked to allow the price to register a quotation gap.
Bearish opening
Type : Bearish
Timeframe : Openning
Here is a more detailed summary of the historical variations registered by RIPPLE - XRP/USD:
Near a new LOW record (1st january)
Type : Bearish
Timeframe : Weekly
Near a new LOW record (1 month)
Type : Bearish
Timeframe : Weekly
Technical
A technical analysis in Daily of this RIPPLE - XRP/USD chart shows a bearish trend. 78.57% of the signals given by moving averages are bearish. Caution: the neutral signals currently given by short-term moving averages show us that the global trend is losing momentum. An assessment of moving averages reveals a bullish signal that could impact this trend:
Bullish price crossover with Moving Average 50
Type : Bullish
Timeframe : Daily
In fact, of the 18 technical indicators analysed by Central Analyzer, 5 are bullish, 6 are neutral and 7 are bearish. Caution: the Central Indicators scanner currently detects an excess:
Williams %R indicator is oversold : under -80
Type : Neutral
Timeframe : Daily
Pivot points : price is over resistance 3
Type : Neutral
Timeframe : Weekly
Price is back over the pivot point
Type : Bullish
Timeframe : Daily
The Central Patterns scanner, which studies chart patterns, resistances and supports, has identified these signals:
Near resistance of channel
Type : Bearish
Timeframe : Daily
Near horizontal support
Type : Bullish
Timeframe : Daily
The presence of these Japanese chandelier patterns detected by Central Candlesticks that could impact the current short-term trend were also noted:
White morning star
Type : Bullish
Timeframe : Daily
Downside Tasuki gap
Type : Bearish
Timeframe : Daily
| S3 | S2 | S1 | Price | R1 | R2 | R3 | |
|---|---|---|---|---|---|---|---|
| ProTrendLines | 0.136500 | 0.165600 | 0.181900 | 0.186100 | 0.202460 | 0.245400 | 0.275163 |
| Change (%) | -26.65% | -11.02% | -2.26% | - | +8.79% | +31.86% | +47.86% |
| Change | -0.049600 | -0.020500 | -0.004200 | - | +0.016360 | +0.059300 | +0.089063 |
| Level | Minor | Minor | Major | - | Intermediate | Minor | Intermediate |
Attention could also be paid to pivot points to set price objectives:
| Pivot points | S3 | S2 | S1 | PP | R1 | R2 | R3 |
|---|---|---|---|---|---|---|---|
| Standard | 0.176067 | 0.179133 | 0.183767 | 0.186833 | 0.191467 | 0.194533 | 0.199167 |
| Camarilla | 0.186283 | 0.186988 | 0.187694 | 0.188400 | 0.189106 | 0.189812 | 0.190518 |
| Woodie | 0.176850 | 0.179525 | 0.184550 | 0.187225 | 0.192250 | 0.194925 | 0.199950 |
| Fibonacci | 0.179133 | 0.182075 | 0.183892 | 0.186833 | 0.189775 | 0.191592 | 0.194533 |
| Pivot points | S3 | S2 | S1 | PP | R1 | R2 | R3 |
|---|---|---|---|---|---|---|---|
| Standard | 0.003279 | 0.004440 | 0.006679 | 0.007840 | 0.010079 | 0.011240 | 0.013479 |
| Camarilla | 0.007984 | 0.008296 | 0.008607 | 0.008919 | 0.009231 | 0.009542 | 0.009854 |
| Woodie | 0.003819 | 0.004710 | 0.007219 | 0.008110 | 0.010619 | 0.011510 | 0.014019 |
| Fibonacci | 0.004440 | 0.005739 | 0.006541 | 0.007840 | 0.009139 | 0.009941 | 0.011240 |
| Pivot points | S3 | S2 | S1 | PP | R1 | R2 | R3 |
|---|---|---|---|---|---|---|---|
| Standard | 0.192767 | 0.241133 | 0.211467 | 0.259833 | 0.230167 | 0.278533 | 0.248867 |
| Camarilla | 0.176658 | 0.178372 | 0.180086 | 0.181800 | 0.183514 | 0.185228 | 0.186943 |
| Woodie | 0.153750 | 0.221625 | 0.172450 | 0.240325 | 0.191150 | 0.259025 | 0.209850 |
| Fibonacci | 0.241133 | 0.248277 | 0.252690 | 0.259833 | 0.266977 | 0.271390 | 0.278533 |
Numerical data
The following is the status of technical indicators and moving averages registered at the time this technical analysis was created:
| RSI (14): | 48.72 | |
| MACD (12,26,9): | 0.0043 | |
| Directional Movement: | -2.206726 | |
| AROON (14): | 35.714283 | |
| DEMA (21): | 0.199145 | |
| Parabolic SAR (0,02-0,02-0,2): | 0.181500 | |
| Elder Ray (13): | -0.008124 | |
| Super Trend (3,10): | 0.269819 | |
| Zig ZAG (10): | 0.185900 | |
| VORTEX (21): | 0.9970 | |
| Stochastique (14,3,5): | 8.66 | |
| TEMA (21): | 0.205525 | |
| Williams %R (14): | -91.34 | |
| Chande Momentum Oscillator (20): | -0.003700 | |
| Repulse (5,40,3): | -2.7741 | |
| ROCnROLL: | 2 | |
| TRIX (15,9): | 0.3819 | |
| Courbe Coppock: | 10.36 |
| MA7: | 0.202886 | |
| MA20: | 0.194660 | |
| MA50: | 0.182028 | |
| MA100: | 0.219740 | |
| MAexp7: | 0.198331 | |
| MAexp20: | 0.194007 | |
| MAexp50: | 0.195735 | |
| MAexp100: | 0.207689 | |
| Price / MA7: | -8.27% | |
| Price / MA20: | -4.40% | |
| Price / MA50: | +2.24% | |
| Price / MA100: | -15.31% | |
| Price / MAexp7: | -6.17% | |
| Price / MAexp20: | -4.08% | |
| Price / MAexp50: | -4.92% | |
| Price / MAexp100: | -10.39% |
About author

Online


Add a comment
Comments
0 comments on the analysis RIPPLE - XRP/USD - Daily