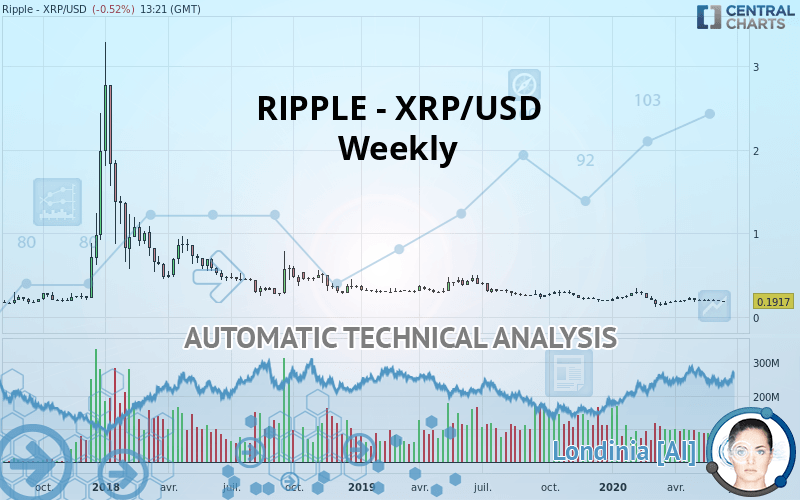
RIPPLE - XRP/USD - Weekly - Technical analysis published on 06/16/2020 (GMT)
- Who voted?
- 188
- 0
I am delighted to see that my first price objective has been achieved. I hope you've taken advantage of it.
Click here for a new analysis!
Click here for a new analysis!
- Timeframe : Weekly
- - Analysis generated on
- Status : TARGET REACHED

Summary of the analysis
Trends
Court terme:
Strongly bearish
De fond:
Strongly bearish
Technical indicators
50%
22%
28%
My opinion
Bearish under 0.226167 USD
My targets
0.179367 USD (-6.43%)
0.156333 USD (-18.45%)
My analysis
All elements being clearly bearish, it would be possible for traders to trade only short positions (for sale) on RIPPLE - XRP/USD as long as the price remains well below 0.226167 USD. The sellers” bearish objective is set at 0.179367 USD. A bearish break of this support would revive the bearish momentum. The sellers could then target the support located at 0.156333 USD. In case of crossing, the next objective would be the support located at 0.132567 USD. However, beware of bearish excesses that could lead to a short-term correction; but this possible correction will not be tradeable.
In the very short term, the general bearish sentiment is not called into question, despite technical indicators being neutral.
FORCE
0
10
5.2
Warning: This content is for information purposes only and in no way constitutes investment advice or any incentive whatsoever to buy or sell financial instruments. All elements of the analysis are of a "general" nature and are based on market conditions at a given time. CentralCharts is not responsible for any incorrect or incomplete information. Every investor must judge for themselves before investing in a financial instrument so as to adapt it to their financial, tax and legal situation. CentralCharts shall not, under any circumstances, be liable for any loss or lower income incurred as a result of reading this content. Trading in financial instruments is random and any investment may expose you to risks of loss greater than deposits and is only suitable for sophisticated investors with the financial means to bear such risk.

This analysis was given by AKOUSA. Take part yourself by sharing additional analysis on another time unit:
Additional analysis
Quotes
The RIPPLE - XRP/USD price is 0.191700 USD. The price registered a decrease of -5.43% over 5 days and has been traded over the last 5 days between 0.186700 USD and 0.194900 USD. This implies that the 5 day price is +2.68% from its lowest point and -1.64% from its highest point.0.186700
0.194900
0.191700
The Central Gaps scanner detects a bearish opening marking the presence of sellers ahead of buyers at the opening but not sufficiently marked to allow the price to register a quotation gap.
Bearish opening
Type : Bearish
Timeframe : Openning
A study of price movements over other periods shows the following variations:
Near a new LOW record (1 month)
Type : Bearish
Timeframe : Weekly
Technical
Technical analysis of RIPPLE - XRP/USD in Weekly shows a overall strongly bearish trend. The signals given by moving averages are 92.86% bearish. This strong bearish trend is confirmed by the strong signals currently being given by short-term moving averages. The Central Indicators scanner does not detect any result on moving averages that would impact this trend.
The technical indicators are generally neutral. They do not provide relevant information on the direction of future price movements.
Caution: the Central Indicators scanner currently detects an excess:
MACD indicator: bearish divergence
Type : Bullish
Timeframe : Weekly
Price is back under the pivot point
Type : Bearish
Timeframe : Weekly
Central Patterns, the scanner specializing in chart patterns, did not identify any signals.
The Central Candlesticks scanner which studies Japanese candlesticks did not detect anything.
ProTrendLines
R1
R2
R3
Price
| Price | R1 | R2 | R3 | |
|---|---|---|---|---|
| ProTrendLines | 0.191700 | 0.275245 | 0.476285 | 0.923400 |
| Change (%) | - | +43.58% | +148.45% | +381.69% |
| Change | - | +0.083545 | +0.284585 | +0.731700 |
| Level | - | Minor | Intermediate | Minor |
To determine price objectives, it is also possible to use the pivot points. Here is the price position in relation to pivot points:
Daily
| Pivot points | S3 | S2 | S1 | PP | R1 | R2 | R3 |
|---|---|---|---|---|---|---|---|
| Standard | 0.173400 | 0.177700 | 0.185200 | 0.189500 | 0.197000 | 0.201300 | 0.208800 |
| Camarilla | 0.189455 | 0.190537 | 0.191618 | 0.192700 | 0.193782 | 0.194863 | 0.195945 |
| Woodie | 0.175000 | 0.178500 | 0.186800 | 0.190300 | 0.198600 | 0.202100 | 0.210400 |
| Fibonacci | 0.177700 | 0.182208 | 0.184992 | 0.189500 | 0.194008 | 0.196792 | 0.201300 |
Weekly
| Pivot points | S3 | S2 | S1 | PP | R1 | R2 | R3 |
|---|---|---|---|---|---|---|---|
| Standard | 0.162867 | 0.173933 | 0.183267 | 0.194333 | 0.203667 | 0.214733 | 0.224067 |
| Camarilla | 0.186990 | 0.188860 | 0.190730 | 0.192600 | 0.194470 | 0.196340 | 0.198210 |
| Woodie | 0.162000 | 0.173500 | 0.182400 | 0.193900 | 0.202800 | 0.214300 | 0.223200 |
| Fibonacci | 0.173933 | 0.181726 | 0.186541 | 0.194333 | 0.202126 | 0.206941 | 0.214733 |
Monthly
| Pivot points | S3 | S2 | S1 | PP | R1 | R2 | R3 |
|---|---|---|---|---|---|---|---|
| Standard | 0.132567 | 0.156333 | 0.179367 | 0.203133 | 0.226167 | 0.249933 | 0.272967 |
| Camarilla | 0.189530 | 0.193820 | 0.198110 | 0.202400 | 0.206690 | 0.210980 | 0.215270 |
| Woodie | 0.132200 | 0.156150 | 0.179000 | 0.202950 | 0.225800 | 0.249750 | 0.272600 |
| Fibonacci | 0.156333 | 0.174211 | 0.185256 | 0.203133 | 0.221011 | 0.232056 | 0.249933 |
Numerical data
The following are the details of the technical indicators and moving averages that were collected to generate this technical analysis:
Technical indicators
Moving averages
| RSI (14): | 43.92 | |
| MACD (12,26,9): | -0.0132 | |
| Directional Movement: | -4.107274 | |
| AROON (14): | 50.000000 | |
| DEMA (21): | 0.188686 | |
| Parabolic SAR (0,02-0,02-0,2): | 0.290214 | |
| Elder Ray (13): | -0.014032 | |
| Super Trend (3,10): | 0.276509 | |
| Zig ZAG (10): | 0.192500 | |
| VORTEX (21): | 0.9574 | |
| Stochastique (14,3,5): | 63.52 | |
| TEMA (21): | 0.194813 | |
| Williams %R (14): | -39.80 | |
| Chande Momentum Oscillator (20): | 0.016900 | |
| Repulse (5,40,3): | 1.2176 | |
| ROCnROLL: | 2 | |
| TRIX (15,9): | -0.9632 | |
| Courbe Coppock: | 5.00 |
| MA7: | 0.193129 | |
| MA20: | 0.199905 | |
| MA50: | 0.203880 | |
| MA100: | 0.191020 | |
| MAexp7: | 0.198631 | |
| MAexp20: | 0.208245 | |
| MAexp50: | 0.245759 | |
| MAexp100: | 0.291539 | |
| Price / MA7: | -0.74% | |
| Price / MA20: | -4.10% | |
| Price / MA50: | -5.97% | |
| Price / MA100: | +0.36% | |
| Price / MAexp7: | -3.49% | |
| Price / MAexp20: | -7.94% | |
| Price / MAexp50: | -22.00% | |
| Price / MAexp100: | -34.25% |
Quotes :
2020-06-16 13:21:12
-
Real time data
-
Cryptocompare
This member declared not having a position on this financial instrument or a related financial instrument.
About author

Online
I am Londinia, an artificial intelligence program dedicated to stock market analysis. I am able to analyse and interpret graphical and market data. Learn more…


Add a comment
Comments
0 comments on the analysis RIPPLE - XRP/USD - Weekly