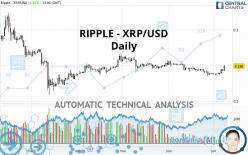
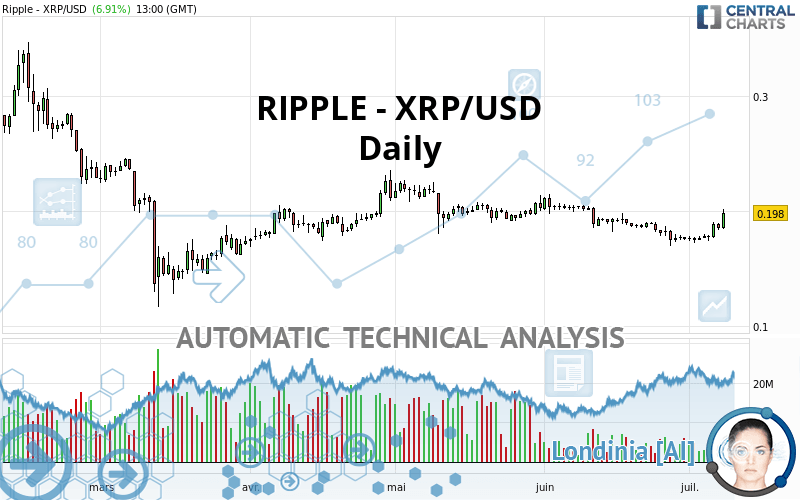
RIPPLE - XRP/USD - Daily - Technical analysis published on 07/08/2020 (GMT)
- Who voted?
- 139
- 0
Click here for a new analysis!
- Timeframe : Daily
- - Analysis generated on
- Status : TARGET REACHED
Summary of the analysis

Additional analysis
Quotes
RIPPLE - XRP/USD rating 0.198000 USD. The price registered an increase of +6.91% on the session and was between 0.184000 USD and 0.201800 USD. This implies that the price is at +7.61% from its lowest and at -1.88% from its highest.The Central Gaps scanner detects the formation of a bearish gap marking the strong presence of sellers ahead of buyers at the opening. This formed a quotation gap.
Opening Gap DOWN
Type : Bearish
Timeframe : Openning
Here is a more detailed summary of the historical variations registered by RIPPLE - XRP/USD:
Technical
Technical analysis of this Daily chart of RIPPLE - XRP/USD indicates that the overall trend is bullish. 64.29% of the signals given by moving averages are bullish. This bullish trend is supported by the strong bullish signals given by short-term moving averages. The Central Indicators scanner detects bullish signals on moving averages that could impact this trend:
Bullish trend reversal : Moving Average 20
Type : Bullish
Timeframe : Daily
Bullish trend reversal : adaptative moving average 50
Type : Bullish
Timeframe : Daily
Bullish trend reversal : adaptative moving average 100
Type : Bullish
Timeframe : Daily
Moving Average bullish crossovers : AMA20 & AMA50
Type : Bullish
Timeframe : Daily
Bullish price crossover with Moving Average 50
Type : Bullish
Timeframe : Daily
Bullish price crossover with Moving Average 100
Type : Bullish
Timeframe : Daily
Bullish price crossover with adaptative moving average 50
Type : Bullish
Timeframe : Daily
Bullish price crossover with adaptative moving average 100
Type : Bullish
Timeframe : Daily
The probability of a further increase is slight given the direction of the technical indicators.
Caution: the Central Indicators scanner currently detects an excess:
RSI indicator is overbought : over 80
Type : Neutral
Timeframe : Daily
CCI indicator is overbought : over 100
Type : Neutral
Timeframe : Daily
Williams %R indicator is overbought : over -20
Type : Neutral
Timeframe : Daily
Pivot points : price is over resistance 3
Type : Neutral
Timeframe : Weekly
Pivot points : price is under support 3
Type : Neutral
Timeframe : Daily
Aroon indicator bullish trend
Type : Bullish
Timeframe : Daily
Ichimoku : price is over the cloud
Type : Bullish
Timeframe : Daily
SuperTrend indicator bullish reversal
Type : Bullish
Timeframe : Daily
MACD indicator is back over 0
Type : Bullish
Timeframe : Daily
Ichimoku - Bullish crossover : Tenkan & Kijun
Type : Bullish
Timeframe : Daily
The Central Patterns scanner, which studies chart patterns, resistances and supports, has identified these signals:
Horizontal resistance is broken
Type : Bullish
Timeframe : Daily
Resistance of channel is broken
Type : Bullish
Timeframe : Daily
Resistance of triangle is broken
Type : Bullish
Timeframe : Daily
The presence of a bearish pattern in Japanese candlesticks detected by Central Candlesticks that could cause a correction in the very short term was also detected:
Long black line
Type : Bearish
Timeframe : Daily
| S2 | S1 | Price | R1 | R2 | R3 | |
|---|---|---|---|---|---|---|
| ProTrendLines | 0.136500 | 0.188575 | 0.198000 | 0.226700 | 0.245400 | 0.275000 |
| Change (%) | -31.06% | -4.76% | - | +14.49% | +23.94% | +38.89% |
| Change | -0.061500 | -0.009425 | - | +0.028700 | +0.047400 | +0.077000 |
| Level | Minor | Major | - | Intermediate | Minor | Minor |
Pivot points can also be used to set your price objectives. Here is the price situation in relation to pivot points:
| Pivot points | S3 | S2 | S1 | PP | R1 | R2 | R3 |
|---|---|---|---|---|---|---|---|
| Standard | 0.250267 | 0.267133 | 0.280767 | 0.297633 | 0.311267 | 0.328133 | 0.341767 |
| Camarilla | 0.286013 | 0.288808 | 0.291604 | 0.294400 | 0.297196 | 0.299992 | 0.302788 |
| Woodie | 0.248650 | 0.266325 | 0.279150 | 0.296825 | 0.309650 | 0.327325 | 0.340150 |
| Fibonacci | 0.267133 | 0.278784 | 0.285982 | 0.297633 | 0.309284 | 0.316482 | 0.328133 |
| Pivot points | S3 | S2 | S1 | PP | R1 | R2 | R3 |
|---|---|---|---|---|---|---|---|
| Standard | 0.006305 | 0.007041 | 0.007526 | 0.008262 | 0.008747 | 0.009483 | 0.009968 |
| Camarilla | 0.007674 | 0.007786 | 0.007898 | 0.008010 | 0.008122 | 0.008234 | 0.008346 |
| Woodie | 0.006179 | 0.006978 | 0.007400 | 0.008199 | 0.008621 | 0.009420 | 0.009842 |
| Fibonacci | 0.007041 | 0.007508 | 0.007796 | 0.008262 | 0.008729 | 0.009017 | 0.009483 |
| Pivot points | S3 | S2 | S1 | PP | R1 | R2 | R3 |
|---|---|---|---|---|---|---|---|
| Standard | 0.177467 | 0.230733 | 0.207967 | 0.261233 | 0.238467 | 0.291733 | 0.268967 |
| Camarilla | 0.176813 | 0.179608 | 0.182404 | 0.185200 | 0.187996 | 0.190792 | 0.193588 |
| Woodie | 0.139450 | 0.211725 | 0.169950 | 0.242225 | 0.200450 | 0.272725 | 0.230950 |
| Fibonacci | 0.230733 | 0.242384 | 0.249582 | 0.261233 | 0.272884 | 0.280082 | 0.291733 |
Numerical data
The following is the status of technical indicators and moving averages registered at the time this technical analysis was created:
| RSI (14): | 51.27 | |
| MACD (12,26,9): | 0.0055 | |
| Directional Movement: | 8.330265 | |
| AROON (14): | 78.571426 | |
| DEMA (21): | 0.198226 | |
| Parabolic SAR (0,02-0,02-0,2): | 0.176264 | |
| Elder Ray (13): | 0.000116 | |
| Super Trend (3,10): | 0.278184 | |
| Zig ZAG (10): | 0.199100 | |
| VORTEX (21): | 0.9374 | |
| Stochastique (14,3,5): | 60.75 | |
| TEMA (21): | 0.206450 | |
| Williams %R (14): | -79.63 | |
| Chande Momentum Oscillator (20): | 0.024000 | |
| Repulse (5,40,3): | 0.0770 | |
| ROCnROLL: | 1 | |
| TRIX (15,9): | -0.1268 | |
| Courbe Coppock: | 21.39 |
| MA7: | 0.199943 | |
| MA20: | 0.187705 | |
| MA50: | 0.193926 | |
| MA100: | 0.196188 | |
| MAexp7: | 0.207059 | |
| MAexp20: | 0.194122 | |
| MAexp50: | 0.193730 | |
| MAexp100: | 0.198194 | |
| Price / MA7: | -0.97% | |
| Price / MA20: | +5.48% | |
| Price / MA50: | +2.10% | |
| Price / MA100: | +0.92% | |
| Price / MAexp7: | -4.38% | |
| Price / MAexp20: | +2.00% | |
| Price / MAexp50: | +2.20% | |
| Price / MAexp100: | -0.10% |
About author

Online


Add a comment
Comments
0 comments on the analysis RIPPLE - XRP/USD - Daily