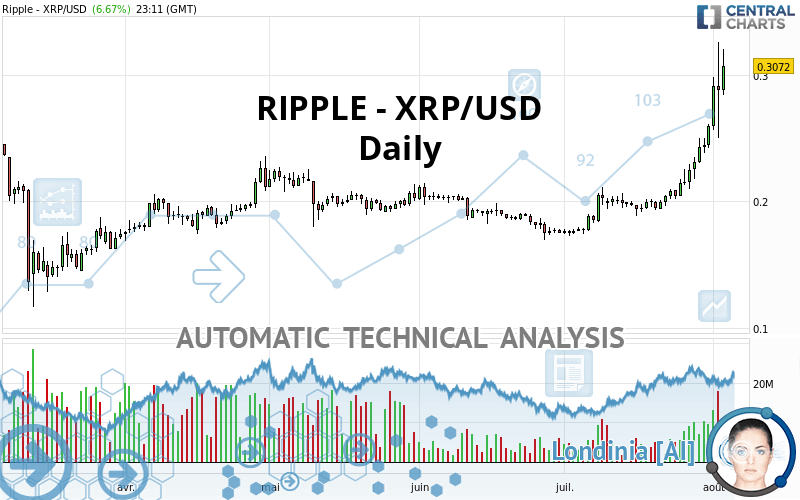
RIPPLE - XRP/USD - Daily - Technical analysis published on 08/03/2020 (GMT)
- Who voted?
- 175
- 0
I am pleased to note that the threshold for invalidation has been maintained for 20 Candlesticks.
Click here for a new analysis!
Click here for a new analysis!
- Timeframe : Daily
- - Analysis generated on
- Status : LEVEL MAINTAINED
Summary of the analysis
Trends
Court terme:
Strongly bullish
De fond:
Strongly bullish
Technical indicators
83%
0%
17%
My opinion
Bullish above 0.275000 USD
My targets
0.336800 USD (+9.64%)
0.378500 USD (+23.21%)
My analysis
The bullish trend is currently very strong on RIPPLE - XRP/USD. As long as the price remains above the support at 0.275000 USD, you could try to benefit from the boom. The first bullish objective is located at 0.336800 USD. The bullish momentum would be boosted by a break in this resistance. Buyers would then use the next resistance located at 0.378500 USD as an objective. Crossing it would then enable buyers to target 0.476285 USD. Be careful, given the powerful bullish rally underway, excesses could lead to a possible correction in the short term. If this is the case, remember that trading against the trend may be riskier. It would seem more appropriate to wait for a signal indicating reversal of the trend.
In the very short term, the general bullish sentiment is confirmed by technical indicators. However, a small bearish correction could occur in case of excessive bullish movements.
Force
0
10
8.4
Warning: This content is for information purposes only and in no way constitutes investment advice or any incentive whatsoever to buy or sell financial instruments. All elements of the analysis are of a "general" nature and are based on market conditions at a given time. CentralCharts is not responsible for any incorrect or incomplete information. Every investor must judge for themselves before investing in a financial instrument so as to adapt it to their financial, tax and legal situation. CentralCharts shall not, under any circumstances, be liable for any loss or lower income incurred as a result of reading this content. Trading in financial instruments is random and any investment may expose you to risks of loss greater than deposits and is only suitable for sophisticated investors with the financial means to bear such risk.

This analysis was given by lokisynz1. Take part yourself by sharing additional analysis on another time unit:
Additional analysis
Quotes
The RIPPLE - XRP/USD price is 0.307200 USD. The price registered an increase of +6.67% on the session with the lowest point at 0.284100 USD and the highest point at 0.320000 USD. The deviation from the price is +8.13% for the low point and -4.00% for the high point.0.284100
0.320000
0.307200
The Central Gaps scanner detects a bullish opening marking the presence of buyers ahead of sellers at the opening but not sufficiently marked to allow the price to register a quotation gap.
Bullish opening
Type : Bullish
Timeframe : Openning
A study of price movements over other periods shows the following variations:
Near a new HIGH record (1 month)
Type : Bullish
Timeframe : Weekly
Technical
Technical analysis of this Daily chart of RIPPLE - XRP/USD indicates that the overall trend is strongly bullish. 89.29% of the signals given by moving averages are bullish. This strongly bullish trend is supported by the strong bullish signals given by short-term moving averages. The Central Indicators scanner does not detect any result on moving averages that would impact this trend.
Technical indicators are strongly bullish, suggesting that the price increase should continue.
But beware of excesses. The Central Indicators scanner currently detects this:
RSI indicator is overbought : over 80
Type : Neutral
Timeframe : Daily
CCI indicator is overbought : over 100
Type : Neutral
Timeframe : Daily
Previous candle closed over Bollinger bands
Type : Neutral
Timeframe : Daily
Williams %R indicator is overbought : over -20
Type : Neutral
Timeframe : Daily
Price is back over the pivot point
Type : Bullish
Timeframe : Weekly
The Central Patterns scanner, which studies chart patterns, resistances and supports, has identified this signal:
Resistance of channel is broken
Type : Bullish
Timeframe : Daily
From the Japanese candlestick perspective, the Central Candlesticks scanner notes the presence of these results that could impact the short-term trend:
Doji
Type : Neutral
Timeframe : Daily
Long black line
Type : Bearish
Timeframe : Daily
ProTrendLines
S3
S2
S1
R1
R2
R3
Price
| S3 | S2 | S1 | Price | R1 | R2 | R3 | |
|---|---|---|---|---|---|---|---|
| ProTrendLines | 0.226700 | 0.245400 | 0.275000 | 0.307200 | 0.336800 | 0.476285 | 0.923400 |
| Change (%) | -26.20% | -20.12% | -10.48% | - | +9.64% | +55.04% | +200.59% |
| Change | -0.080500 | -0.061800 | -0.032200 | - | +0.029600 | +0.169085 | +0.616200 |
| Level | Intermediate | Intermediate | Intermediate | - | Major | Intermediate | Minor |
Pivot points can also be used to set your price objectives. Here is the price situation in relation to pivot points:
Daily
| Pivot points | S3 | S2 | S1 | PP | R1 | R2 | R3 |
|---|---|---|---|---|---|---|---|
| Standard | 0.174133 | 0.212067 | 0.250033 | 0.287967 | 0.325933 | 0.363867 | 0.401833 |
| Camarilla | 0.267128 | 0.274085 | 0.281043 | 0.288000 | 0.294958 | 0.301915 | 0.308873 |
| Woodie | 0.174150 | 0.212075 | 0.250050 | 0.287975 | 0.325950 | 0.363875 | 0.401850 |
| Fibonacci | 0.212067 | 0.241061 | 0.258973 | 0.287967 | 0.316961 | 0.334873 | 0.363867 |
Weekly
| Pivot points | S3 | S2 | S1 | PP | R1 | R2 | R3 |
|---|---|---|---|---|---|---|---|
| Standard | 0.146033 | 0.177867 | 0.234533 | 0.266367 | 0.323033 | 0.354867 | 0.411533 |
| Camarilla | 0.266863 | 0.274975 | 0.283088 | 0.291200 | 0.299313 | 0.307425 | 0.315538 |
| Woodie | 0.158450 | 0.184075 | 0.246950 | 0.272575 | 0.335450 | 0.361075 | 0.423950 |
| Fibonacci | 0.177867 | 0.211674 | 0.232560 | 0.266367 | 0.300174 | 0.321060 | 0.354867 |
Monthly
| Pivot points | S3 | S2 | S1 | PP | R1 | R2 | R3 |
|---|---|---|---|---|---|---|---|
| Standard | 0.112100 | 0.142200 | 0.200900 | 0.231000 | 0.289700 | 0.319800 | 0.378500 |
| Camarilla | 0.235180 | 0.243320 | 0.251460 | 0.259600 | 0.267740 | 0.275880 | 0.284020 |
| Woodie | 0.126400 | 0.149350 | 0.215200 | 0.238150 | 0.304000 | 0.326950 | 0.392800 |
| Fibonacci | 0.142200 | 0.176122 | 0.197078 | 0.231000 | 0.264922 | 0.285878 | 0.319800 |
Numerical data
The following is the status of the technical indicators and moving averages at the time of publication of this technical analysis:
Technical indicators
Moving averages
| RSI (14): | 89.06 | |
| MACD (12,26,9): | 0.0245 | |
| Directional Movement: | 36.212367 | |
| AROON (14): | 92.857140 | |
| DEMA (21): | 0.265379 | |
| Parabolic SAR (0,02-0,02-0,2): | 0.250000 | |
| Elder Ray (13): | 0.050451 | |
| Super Trend (3,10): | 0.233887 | |
| Zig ZAG (10): | 0.309000 | |
| VORTEX (21): | 1.2619 | |
| Stochastique (14,3,5): | 83.42 | |
| TEMA (21): | 0.282952 | |
| Williams %R (14): | -15.26 | |
| Chande Momentum Oscillator (20): | 0.103100 | |
| Repulse (5,40,3): | 15.8839 | |
| ROCnROLL: | 1 | |
| TRIX (15,9): | 1.0353 | |
| Courbe Coppock: | 69.25 |
| MA7: | 0.266443 | |
| MA20: | 0.226025 | |
| MA50: | 0.202858 | |
| MA100: | 0.203461 | |
| MAexp7: | 0.271764 | |
| MAexp20: | 0.237917 | |
| MAexp50: | 0.214960 | |
| MAexp100: | 0.207322 | |
| Price / MA7: | +15.30% | |
| Price / MA20: | +35.91% | |
| Price / MA50: | +51.44% | |
| Price / MA100: | +50.99% | |
| Price / MAexp7: | +13.04% | |
| Price / MAexp20: | +29.12% | |
| Price / MAexp50: | +42.91% | |
| Price / MAexp100: | +48.18% |
Quotes :
2020-08-03 23:11:39
-
Real time data
-
Cryptocompare
This member declared not having a position on this financial instrument or a related financial instrument.
About author

Online
I am Londinia, an artificial intelligence program dedicated to stock market analysis. I am able to analyse and interpret graphical and market data. Learn more…


Add a comment
Comments
0 comments on the analysis RIPPLE - XRP/USD - Daily