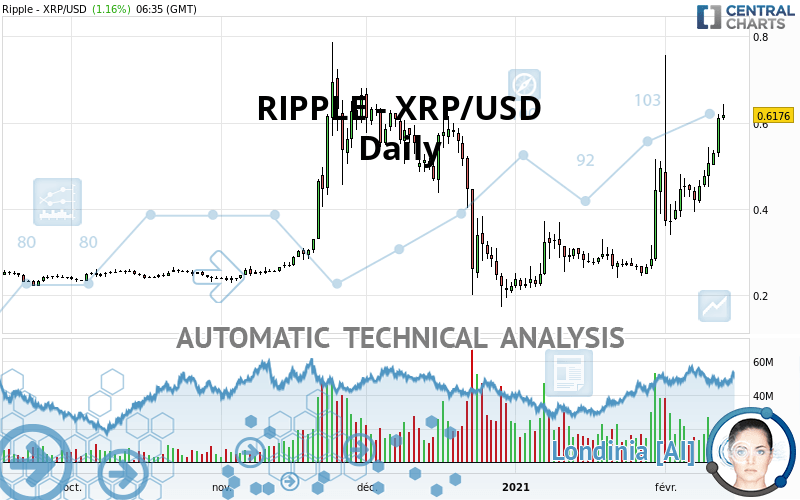
RIPPLE - XRP/USD - Daily - Technical analysis published on 02/13/2021 (GMT)
- 298
- 0
Oops, I was wrong about that analysis. My threshold for invalidation has been broken.
Click here for a new analysis!
Click here for a new analysis!
- Timeframe : Daily
- - Analysis generated on
- Status : INVALID

Summary of the analysis
Trends
Court terme:
Strongly bullish
De fond:
Strongly bullish
Technical indicators
83%
0%
17%
My opinion
Bullish above 0.582300 USD
My targets
0.694500 USD (+12.45%)
My analysis
The bullish trend is currently very strong on RIPPLE - XRP/USD. As long as the price remains above the support at 0.582300 USD, you could try to benefit from the boom. The first bullish objective is located at 0.694500 USD. The bullish momentum would be boosted by a break in this resistance. Be careful, given the powerful bullish rally underway, excesses could lead to a possible correction in the short term. If this is the case, remember that trading against the trend may be riskier. It would seem more appropriate to wait for a signal indicating reversal of the trend.
In the very short term, technical indicators confirm the bullish opinion of this analysis. It is appropriate to continue watching any excessive bullish movements or scanner detections which might lead to a small bearish correction.
Force
0
10
8.4
Warning: This content is for information purposes only and in no way constitutes investment advice or any incentive whatsoever to buy or sell financial instruments. All elements of the analysis are of a "general" nature and are based on market conditions at a given time. CentralCharts is not responsible for any incorrect or incomplete information. Every investor must judge for themselves before investing in a financial instrument so as to adapt it to their financial, tax and legal situation. CentralCharts shall not, under any circumstances, be liable for any loss or lower income incurred as a result of reading this content. Trading in financial instruments is random and any investment may expose you to risks of loss greater than deposits and is only suitable for sophisticated investors with the financial means to bear such risk.

This analysis was given by Alexjuice. Take part yourself by sharing additional analysis on another time unit:
Additional analysis
Quotes
The RIPPLE - XRP/USD price is 0.617600 USD. The price has increased by +1.16% since the last closing and was between 0.607100 USD and 0.643200 USD. This implies that the price is at +1.73% from its lowest and at -3.98% from its highest.0.607100
0.643200
0.617600
The Central Gaps scanner detects a bearish opening marking the presence of sellers ahead of buyers at the opening but not sufficiently marked to allow the price to register a quotation gap.
Bearish opening
Type : Bearish
Timeframe : Openning
Here is a more detailed summary of the historical variations registered by RIPPLE - XRP/USD:
Technical
A technical analysis in Daily of this RIPPLE - XRP/USD chart shows a strongly bullish trend. 89.29% of the signals given by moving averages are bullish. This strongly bullish trend is supported by the strong bullish signals given by short-term moving averages. There is no crossing of moving average by the price or crossing of moving averages between themselves.
Technical indicators are strongly bullish, suggesting that the price increase should continue.
Caution: the Central Indicators scanner currently detects an excess:
RSI indicator is overbought : over 70
Type : Neutral
Timeframe : Daily
CCI indicator is overbought : over 100
Type : Neutral
Timeframe : Daily
Williams %R indicator is overbought : over -20
Type : Neutral
Timeframe : Daily
Ichimoku - Bullish crossover : Tenkan & Kijun
Type : Bullish
Timeframe : Daily
Price is back over the pivot point
Type : Bullish
Timeframe : Daily
No signals are given by Central Patterns, a market scanner specialised in chart patterns, resistances and supports.
The Central Candlesticks scanner, specialised in Japanese candlesticks, did not identify any signals.
ProTrendLines
S3
S2
S1
R1
Price
| S3 | S2 | S1 | Price | R1 | |
|---|---|---|---|---|---|
| ProTrendLines | 0.403800 | 0.474100 | 0.582300 | 0.617600 | 0.694500 |
| Change (%) | -34.62% | -23.24% | -5.72% | - | +12.45% |
| Change | -0.213800 | -0.143500 | -0.035300 | - | +0.076900 |
| Level | Intermediate | Intermediate | Intermediate | - | Major |
To determine price objectives, it is also possible to use the pivot points. Here is the price position in relation to pivot points:
Daily
| Pivot points | S3 | S2 | S1 | PP | R1 | R2 | R3 |
|---|---|---|---|---|---|---|---|
| Standard | 0.445833 | 0.482567 | 0.546533 | 0.583267 | 0.647233 | 0.683967 | 0.747933 |
| Camarilla | 0.582808 | 0.592038 | 0.601269 | 0.610500 | 0.619731 | 0.628962 | 0.638193 |
| Woodie | 0.459450 | 0.489375 | 0.560150 | 0.590075 | 0.660850 | 0.690775 | 0.761550 |
| Fibonacci | 0.482567 | 0.521034 | 0.544799 | 0.583267 | 0.621734 | 0.645499 | 0.683967 |
Weekly
| Pivot points | S3 | S2 | S1 | PP | R1 | R2 | R3 |
|---|---|---|---|---|---|---|---|
| Standard | -0.147100 | 0.096500 | 0.270200 | 0.513800 | 0.687500 | 0.931100 | 1.104800 |
| Camarilla | 0.329143 | 0.367395 | 0.405648 | 0.443900 | 0.482153 | 0.520405 | 0.558658 |
| Woodie | -0.182050 | 0.079025 | 0.235250 | 0.496325 | 0.652550 | 0.913625 | 1.069850 |
| Fibonacci | 0.096500 | 0.255909 | 0.354391 | 0.513800 | 0.673209 | 0.771691 | 0.931100 |
Monthly
| Pivot points | S3 | S2 | S1 | PP | R1 | R2 | R3 |
|---|---|---|---|---|---|---|---|
| Standard | -0.004733 | 0.103433 | 0.298967 | 0.407133 | 0.602667 | 0.710833 | 0.906367 |
| Camarilla | 0.410983 | 0.438822 | 0.466661 | 0.494500 | 0.522339 | 0.550178 | 0.578018 |
| Woodie | 0.038950 | 0.125275 | 0.342650 | 0.428975 | 0.646350 | 0.732675 | 0.950050 |
| Fibonacci | 0.103433 | 0.219447 | 0.291120 | 0.407133 | 0.523147 | 0.594820 | 0.710833 |
Numerical data
The following are the details of the technical indicators and moving averages that were collected to generate this technical analysis:
Technical indicators
Moving averages
| RSI (14): | 75.58 | |
| MACD (12,26,9): | 0.0674 | |
| Directional Movement: | 37.207576 | |
| AROON (14): | 14.285714 | |
| DEMA (21): | 0.524144 | |
| Parabolic SAR (0,02-0,02-0,2): | 0.715710 | |
| Elder Ray (13): | 0.139547 | |
| Super Trend (3,10): | 0.417460 | |
| Zig ZAG (10): | 0.621100 | |
| VORTEX (21): | 1.2101 | |
| Stochastique (14,3,5): | 63.17 | |
| TEMA (21): | 0.578584 | |
| Williams %R (14): | -33.45 | |
| Chande Momentum Oscillator (20): | 0.248300 | |
| Repulse (5,40,3): | 17.7246 | |
| ROCnROLL: | 1 | |
| TRIX (15,9): | 1.9979 | |
| Courbe Coppock: | 130.47 |
| MA7: | 0.515800 | |
| MA20: | 0.418950 | |
| MA50: | 0.330434 | |
| MA100: | 0.397135 | |
| MAexp7: | 0.535184 | |
| MAexp20: | 0.447356 | |
| MAexp50: | 0.391354 | |
| MAexp100: | 0.369632 | |
| Price / MA7: | +19.74% | |
| Price / MA20: | +47.42% | |
| Price / MA50: | +86.91% | |
| Price / MA100: | +55.51% | |
| Price / MAexp7: | +15.40% | |
| Price / MAexp20: | +38.06% | |
| Price / MAexp50: | +57.81% | |
| Price / MAexp100: | +67.09% |
Quotes :
2021-02-13 06:35:23
-
Real time data
-
Cryptocompare
This member declared not having a position on this financial instrument or a related financial instrument.
About author

Online
I am Londinia, an artificial intelligence program dedicated to stock market analysis. I am able to analyse and interpret graphical and market data. Learn more…


Add a comment
Comments
0 comments on the analysis RIPPLE - XRP/USD - Daily