RIPPLE - XRP/USD - Daily - Technical analysis published on 04/07/2021 (GMT)
- 320
- 0
- Timeframe : Daily
- - Analysis generated on
- Status : WITHOUT TARGET

Summary of the analysis

Additional analysis
Quotes
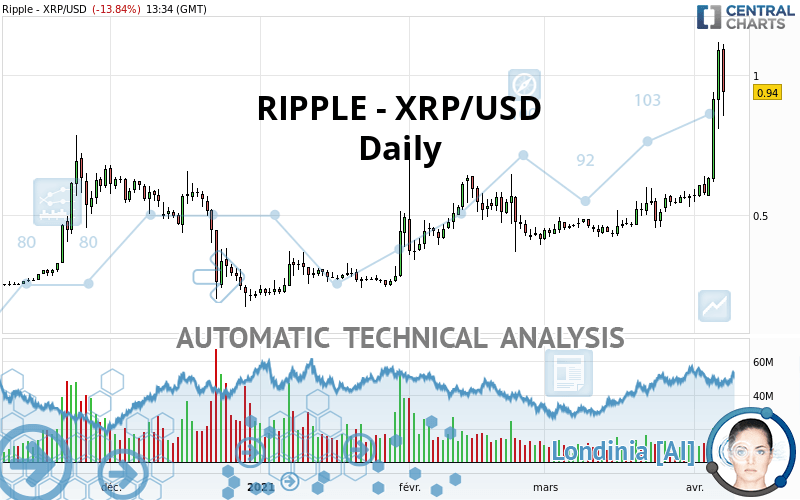
The RIPPLE - XRP/USD price is 0.940000 USD. The price registered a decrease of -13.84% on the session and was traded between 0.855500 USD and 1.111400 USD over the period. The price is currently at +9.88% from its lowest and -15.42% from its highest.The Central Gaps scanner detects a bullish opening marking the presence of buyers ahead of sellers at the opening but not sufficiently marked to allow the price to register a quotation gap.
Bullish opening
Type : Bullish
Timeframe : Openning
Here is a more detailed summary of the historical variations registered by RIPPLE - XRP/USD:
Near a new HIGH record (1st january)
Type : Bullish
Timeframe : Weekly
Near a new HIGH record (1 month)
Type : Bullish
Timeframe : Weekly
Technical
Technical analysis of this Daily chart of RIPPLE - XRP/USD indicates that the overall trend is strongly bullish. 92.86% of the signals given by moving averages are bullish. This strongly bullish trend is supported by the strong bullish signals given by short-term moving averages. The Central Indicators scanner detects a bullish signal on moving averages that could impact this trend:
Moving Average bullish crossovers : AMA50 & AMA100
Type : Bullish
Timeframe : Daily
In fact, 14 technical indicators on 18 studied are currently positioned bullish. Caution: the Central Indicators scanner currently detects an excess:
RSI indicator is overbought : over 80
Type : Neutral
Timeframe : Daily
CCI indicator is overbought : over 100
Type : Neutral
Timeframe : Daily
Previous candle closed over Bollinger bands
Type : Neutral
Timeframe : Daily
CCI indicator: bearish divergence
Type : Bearish
Timeframe : Daily
MACD indicator: bearish divergence
Type : Bearish
Timeframe : Daily
MACD indicator: bullish divergence
Type : Bullish
Timeframe : Daily
RSI indicator: bearish divergence
Type : Bearish
Timeframe : Daily
Williams %R indicator is overbought : over -20
Type : Neutral
Timeframe : Daily
Pivot points : price is over resistance 3
Type : Neutral
Timeframe : Daily
Pivot points : price is over resistance 3
Type : Neutral
Timeframe : Weekly
Pivot points : price is under support 3
Type : Neutral
Timeframe : Daily
The Central Patterns scanner, which studies chart patterns, resistances and supports, has identified these signals:
Resistance of channel is broken
Type : Bullish
Timeframe : Daily
Resistance of triangle is broken
Type : Bullish
Timeframe : Daily
The presence of these bullish Japanese candlestick patterns detected by Central Candlesticks that could cause a very short term rebound were also noted:
Long white line
Type : Bullish
Timeframe : Daily
Three white soldiers
Type : Bullish
Timeframe : Daily
| S3 | S2 | S1 | Price | |
|---|---|---|---|---|
| ProTrendLines | 0.582300 | 0.634800 | 0.694500 | 0.940000 |
| Change (%) | -38.05% | -32.47% | -26.12% | - |
| Change | -0.357700 | -0.305200 | -0.245500 | - |
| Level | Intermediate | Intermediate | Major | - |
Attention could also be paid to pivot points to set price objectives:
| Pivot points | S3 | S2 | S1 | PP | R1 | R2 | R3 |
|---|---|---|---|---|---|---|---|
| Standard | 0.584667 | 0.697333 | 0.894167 | 1.006833 | 1.203667 | 1.316333 | 1.513167 |
| Camarilla | 1.005888 | 1.034258 | 1.062629 | 1.091000 | 1.119371 | 1.147742 | 1.176113 |
| Woodie | 0.626750 | 0.718375 | 0.936250 | 1.027875 | 1.245750 | 1.337375 | 1.555250 |
| Fibonacci | 0.697333 | 0.815562 | 0.888604 | 1.006833 | 1.125062 | 1.198104 | 1.316333 |
| Pivot points | S3 | S2 | S1 | PP | R1 | R2 | R3 |
|---|---|---|---|---|---|---|---|
| Standard | 0.412767 | 0.471033 | 0.525167 | 0.583433 | 0.637567 | 0.695833 | 0.749967 |
| Camarilla | 0.548390 | 0.558693 | 0.568997 | 0.579300 | 0.589603 | 0.599907 | 0.610210 |
| Woodie | 0.410700 | 0.470000 | 0.523100 | 0.582400 | 0.635500 | 0.694800 | 0.747900 |
| Fibonacci | 0.471033 | 0.513970 | 0.540497 | 0.583433 | 0.626370 | 0.652897 | 0.695833 |
| Pivot points | S3 | S2 | S1 | PP | R1 | R2 | R3 |
|---|---|---|---|---|---|---|---|
| Standard | 0.268167 | 0.340633 | 0.455067 | 0.527533 | 0.641967 | 0.714433 | 0.828867 |
| Camarilla | 0.518103 | 0.535235 | 0.552368 | 0.569500 | 0.586633 | 0.603765 | 0.620898 |
| Woodie | 0.289150 | 0.351125 | 0.476050 | 0.538025 | 0.662950 | 0.724925 | 0.849850 |
| Fibonacci | 0.340633 | 0.412029 | 0.456138 | 0.527533 | 0.598929 | 0.643038 | 0.714433 |
Numerical data
The following is the status of the technical indicators and moving averages at the time of publication of this technical analysis:
| RSI (14): | 71.31 | |
| MACD (12,26,9): | 0.1023 | |
| Directional Movement: | 36.411970 | |
| AROON (14): | 92.857140 | |
| DEMA (21): | 0.769015 | |
| Parabolic SAR (0,02-0,02-0,2): | 0.620300 | |
| Elder Ray (13): | 0.267758 | |
| Super Trend (3,10): | 0.662329 | |
| Zig ZAG (10): | 0.920700 | |
| VORTEX (21): | 1.2182 | |
| Stochastique (14,3,5): | 86.76 | |
| TEMA (21): | 0.849455 | |
| Williams %R (14): | -29.25 | |
| Chande Momentum Oscillator (20): | 0.360900 | |
| Repulse (5,40,3): | 17.3144 | |
| ROCnROLL: | 1 | |
| TRIX (15,9): | 1.5163 | |
| Courbe Coppock: | 100.70 |
| MA7: | 0.762000 | |
| MA20: | 0.614205 | |
| MA50: | 0.528824 | |
| MA100: | 0.438168 | |
| MAexp7: | 0.815448 | |
| MAexp20: | 0.659764 | |
| MAexp50: | 0.556376 | |
| MAexp100: | 0.489231 | |
| Price / MA7: | +23.36% | |
| Price / MA20: | +53.04% | |
| Price / MA50: | +77.75% | |
| Price / MA100: | +114.53% | |
| Price / MAexp7: | +15.27% | |
| Price / MAexp20: | +42.48% | |
| Price / MAexp50: | +68.95% | |
| Price / MAexp100: | +92.14% |
About author

Online


Add a comment
Comments
0 comments on the analysis RIPPLE - XRP/USD - Daily