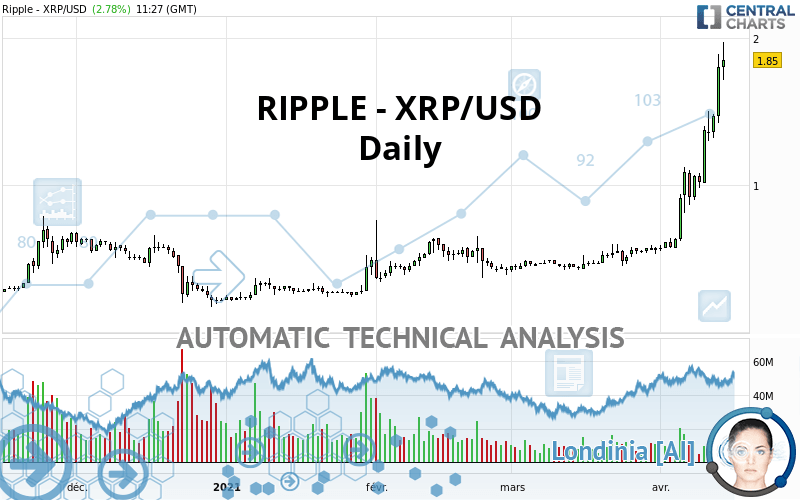
RIPPLE - XRP/USD - Daily - Technical analysis published on 04/14/2021 (GMT)
- 237
- 0
- Timeframe : Daily
- - Analysis generated on
- Status : WITHOUT TARGET

Summary of the analysis

Additional analysis
Quotes
The RIPPLE - XRP/USD rating is 1.85 USD. On the day, this instrument gained +2.78% and was between 1.71 USD and 1.97 USD. This implies that the price is at +8.19% from its lowest and at -6.09% from its highest.The Central Gaps scanner detects a bullish opening marking the presence of buyers ahead of sellers at the opening but not sufficiently marked to allow the price to register a quotation gap.
Bullish opening
Type : Bullish
Timeframe : Openning
So that you have an overall view of the price change, here is a table showing the variations over several periods:
New HIGH record (1 year)
Type : Bullish
Timeframe : Weekly
New HIGH record (1st january)
Type : Bullish
Timeframe : Weekly
New HIGH record (1 month)
Type : Bullish
Timeframe : Weekly
Technical
A technical analysis in Daily of this RIPPLE - XRP/USD chart shows a strongly bullish trend. The signals given by the moving averages are 92.86% bullish. This strong bullish trend is confirmed by the strong signals currently being given by short-term moving averages. There is no crossing of moving average by the price or crossing of moving averages between themselves.
An assessment of technical indicators shows a strong bullish signal.
Caution: the Central Indicators scanner currently detects an excess:
RSI indicator is overbought : over 80
Type : Neutral
Timeframe : Daily
CCI indicator is overbought : over 100
Type : Neutral
Timeframe : Daily
CCI indicator: bearish divergence
Type : Bearish
Timeframe : Daily
MACD indicator: bearish divergence
Type : Bearish
Timeframe : Daily
MACD indicator: bullish divergence
Type : Bullish
Timeframe : Daily
Williams %R indicator is overbought : over -20
Type : Neutral
Timeframe : Daily
Pivot points : price is over resistance 3
Type : Neutral
Timeframe : Daily
Pivot points : price is over resistance 3
Type : Neutral
Timeframe : Weekly
Pivot points : price is under support 3
Type : Neutral
Timeframe : Daily
Central Patterns, the scanner specializing in chart patterns, did not identify any signals.
The presence of a bullish Japanese candlestick pattern detected by Central Candlesticks that could cause a very short term rebound was also detected:
Long white line
Type : Bullish
Timeframe : Daily
| S3 | S2 | S1 | Price | |
|---|---|---|---|---|
| ProTrendLines | 0.47 | 0.63 | 1.09 | 1.85 |
| Change (%) | -74.59% | -65.95% | -41.08% | - |
| Change | -1.38 | -1.22 | -0.76 | - |
| Level | Major | Major | Intermediate | - |
Attention could also be paid to pivot points to set price objectives:
| Pivot points | S3 | S2 | S1 | PP | R1 | R2 | R3 |
|---|---|---|---|---|---|---|---|
| Standard | 1.05 | 1.23 | 1.52 | 1.70 | 1.99 | 2.17 | 2.46 |
| Camarilla | 1.67 | 1.71 | 1.76 | 1.80 | 1.84 | 1.89 | 1.93 |
| Woodie | 1.10 | 1.26 | 1.57 | 1.73 | 2.04 | 2.20 | 2.51 |
| Fibonacci | 1.23 | 1.41 | 1.52 | 1.70 | 1.88 | 1.99 | 2.17 |
| Pivot points | S3 | S2 | S1 | PP | R1 | R2 | R3 |
|---|---|---|---|---|---|---|---|
| Standard | 0.00 | 0.28 | 0.83 | 1.11 | 1.66 | 1.94 | 2.49 |
| Camarilla | 1.14 | 1.22 | 1.29 | 1.37 | 1.45 | 1.52 | 1.60 |
| Woodie | 0.13 | 0.35 | 0.96 | 1.18 | 1.79 | 2.01 | 2.62 |
| Fibonacci | 0.28 | 0.60 | 0.80 | 1.11 | 1.43 | 1.63 | 1.94 |
| Pivot points | S3 | S2 | S1 | PP | R1 | R2 | R3 |
|---|---|---|---|---|---|---|---|
| Standard | 0.26 | 0.34 | 0.45 | 0.53 | 0.64 | 0.72 | 0.83 |
| Camarilla | 0.52 | 0.54 | 0.55 | 0.57 | 0.59 | 0.61 | 0.62 |
| Woodie | 0.29 | 0.35 | 0.48 | 0.54 | 0.67 | 0.73 | 0.86 |
| Fibonacci | 0.34 | 0.41 | 0.45 | 0.53 | 0.60 | 0.64 | 0.72 |
Numerical data
The following are the details of the technical indicators and moving averages that were collected to generate this technical analysis:
| RSI (14): | 85.17 | |
| MACD (12,26,9): | 0.2900 | |
| Directional Movement: | 47.66 | |
| AROON (14): | 100.00 | |
| DEMA (21): | 1.41 | |
| Parabolic SAR (0,02-0,02-0,2): | 1.25 | |
| Elder Ray (13): | 0.61 | |
| Super Trend (3,10): | 1.27 | |
| Zig ZAG (10): | 1.84 | |
| VORTEX (21): | 1.4000 | |
| Stochastique (14,3,5): | 93.88 | |
| TEMA (21): | 1.62 | |
| Williams %R (14): | -8.25 | |
| Chande Momentum Oscillator (20): | 1.24 | |
| Repulse (5,40,3): | 30.9600 | |
| ROCnROLL: | 1 | |
| TRIX (15,9): | 4.3300 | |
| Courbe Coppock: | 311.25 |
| MA7: | 1.42 | |
| MA20: | 0.93 | |
| MA50: | 0.65 | |
| MA100: | 0.52 | |
| MAexp7: | 1.48 | |
| MAexp20: | 1.07 | |
| MAexp50: | 0.77 | |
| MAexp100: | 0.61 | |
| Price / MA7: | +30.28% | |
| Price / MA20: | +98.92% | |
| Price / MA50: | +184.62% | |
| Price / MA100: | +255.77% | |
| Price / MAexp7: | +25.00% | |
| Price / MAexp20: | +72.90% | |
| Price / MAexp50: | +140.26% | |
| Price / MAexp100: | +203.28% |
About author

Online


Add a comment
Comments
0 comments on the analysis RIPPLE - XRP/USD - Daily