RIPPLE - XRP/USD - Daily - Technical analysis published on 03/21/2022 (GMT)
- 192
- 0
Oops, I was wrong about that analysis. My threshold for invalidation has been broken.
Click here for a new analysis!
Click here for a new analysis!
- Timeframe : Daily
- - Analysis generated on
- Status : INVALID
Summary of the analysis
Trends
Short term:
Strongly bullish
Underlying:
Bullish
Technical indicators
89%
0%
11%
My opinion
Bullish above 0.783000 USD
My targets
0.885222 USD (+8.70%)
0.994715 USD (+22.14%)
My analysis
RIPPLE - XRP/USD is part of a very strong bullish trend. Traders may consider trading only long positions (at the time of purchase) as long as the price remains well above 0.783000 USD. The next resistance located at 0.885222 USD is the next bullish target to be reached. A bullish break in this resistance would boost the bullish momentum. The bullish movement could then continue towards the next resistance located at 0.994715 USD. After this resistance, buyers could then target 1.160200 USD.
In the very short term, the general bullish sentiment is confirmed by technical indicators. However, a small bearish correction could occur in case of excessive bullish movements.
Force
0
10
6.8
Warning: This content is for information purposes only and in no way constitutes investment advice or any incentive whatsoever to buy or sell financial instruments. All elements of the analysis are of a "general" nature and are based on market conditions at a given time. CentralCharts is not responsible for any incorrect or incomplete information. Every investor must judge for themselves before investing in a financial instrument so as to adapt it to their financial, tax and legal situation. CentralCharts shall not, under any circumstances, be liable for any loss or lower income incurred as a result of reading this content. Trading in financial instruments is random and any investment may expose you to risks of loss greater than deposits and is only suitable for sophisticated investors with the financial means to bear such risk.

This analysis was given by Vincent Launay. Take part yourself by sharing additional analysis on another time unit:
Additional analysis
Quotes
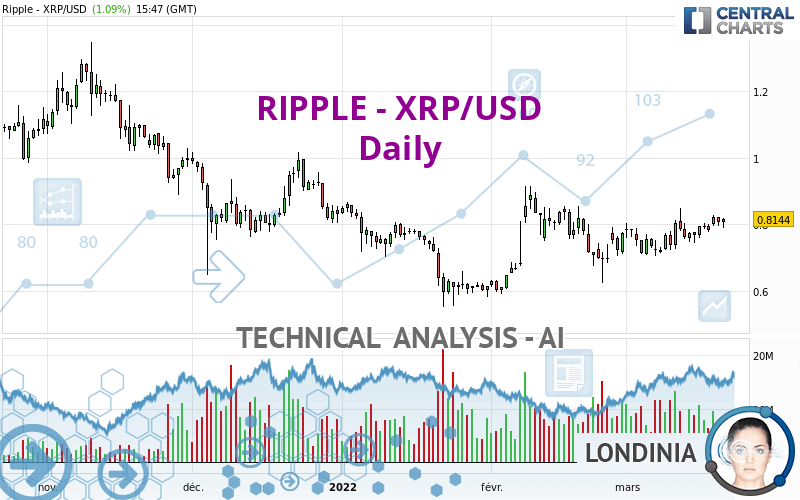
The RIPPLE - XRP/USD price is 0.814400 USD. The price has increased by +1.09% since the last closing and was between 0.788700 USD and 0.819100 USD. This implies that the price is at +3.26% from its lowest and at -0.57% from its highest.0.788700
0.819100
0.814400
The Central Gaps scanner detects a bearish opening. A small advantage for sellers in the very short term.
Bearish opening
Type : Bearish
Timeframe : Openning
A study of price movements over other periods shows the following variations:
Near a new HIGH record (1 month)
Type : Bullish
Timeframe : Weekly
Technical
A technical analysis in Daily of this RIPPLE - XRP/USD chart shows a bullish trend. The signals returned by the moving averages are 71.43% bullish. This bullish trend is reinforced by the strong signals currently being given by short-term moving averages. The Central Indicators scanner does not detect any result on moving averages that would impact this trend.
In fact, 16 technical indicators on 18 studied are currently bullish. Caution: the Central Indicators scanner currently detects an excess:
CCI indicator is overbought : over 100
Type : Neutral
Timeframe : Daily
Price is back over the pivot point
Type : Bullish
Timeframe : Daily
The Central Patterns scanner, which studies chart patterns, resistances and supports, has identified this signal:
Near resistance of channel
Type : Bearish
Timeframe : Daily
The Central Candlesticks scanner, specialised in Japanese candlesticks, did not identify any signals.
ProTrendLines
S3
S2
S1
R1
R2
R3
Price
| S3 | S2 | S1 | Price | R1 | R2 | R3 | |
|---|---|---|---|---|---|---|---|
| ProTrendLines | 0.596200 | 0.718880 | 0.783000 | 0.814400 | 0.885222 | 0.994715 | 1.160200 |
| Change (%) | -26.79% | -11.73% | -3.86% | - | +8.70% | +22.14% | +42.46% |
| Change | -0.218200 | -0.095520 | -0.031400 | - | +0.070822 | +0.180315 | +0.345800 |
| Level | Major | Major | Intermediate | - | Intermediate | Intermediate | Intermediate |
Attention could also be paid to pivot points to set price objectives:
Daily
| Pivot points | S3 | S2 | S1 | PP | R1 | R2 | R3 |
|---|---|---|---|---|---|---|---|
| Standard | 0.765233 | 0.779867 | 0.792733 | 0.807367 | 0.820233 | 0.834867 | 0.847733 |
| Camarilla | 0.798038 | 0.800558 | 0.803079 | 0.805600 | 0.808121 | 0.810642 | 0.813163 |
| Woodie | 0.764350 | 0.779425 | 0.791850 | 0.806925 | 0.819350 | 0.834425 | 0.846850 |
| Fibonacci | 0.779867 | 0.790372 | 0.796862 | 0.807367 | 0.817872 | 0.824362 | 0.834867 |
Weekly
| Pivot points | S3 | S2 | S1 | PP | R1 | R2 | R3 |
|---|---|---|---|---|---|---|---|
| Standard | 0.682033 | 0.712367 | 0.766133 | 0.796467 | 0.850233 | 0.880567 | 0.934333 |
| Camarilla | 0.796773 | 0.804482 | 0.812191 | 0.819900 | 0.827609 | 0.835318 | 0.843028 |
| Woodie | 0.693750 | 0.718225 | 0.777850 | 0.802325 | 0.861950 | 0.886425 | 0.946050 |
| Fibonacci | 0.712367 | 0.744493 | 0.764341 | 0.796467 | 0.828593 | 0.848441 | 0.880567 |
Monthly
| Pivot points | S3 | S2 | S1 | PP | R1 | R2 | R3 |
|---|---|---|---|---|---|---|---|
| Standard | 0.277000 | 0.433300 | 0.602600 | 0.758900 | 0.928200 | 1.084500 | 1.253800 |
| Camarilla | 0.682360 | 0.712207 | 0.742053 | 0.771900 | 0.801747 | 0.831593 | 0.861440 |
| Woodie | 0.283500 | 0.436550 | 0.609100 | 0.762150 | 0.934700 | 1.087750 | 1.260300 |
| Fibonacci | 0.433300 | 0.557679 | 0.634521 | 0.758900 | 0.883279 | 0.960121 | 1.084500 |
Numerical data
The following are the details of the technical indicators and moving averages that were collected to generate this technical analysis:
Technical indicators
Moving averages
| RSI (14): | 57.08 | |
| MACD (12,26,9): | 0.0157 | |
| Directional Movement: | 7.538127 | |
| AROON (14): | 35.714286 | |
| DEMA (21): | 0.796034 | |
| Parabolic SAR (0,02-0,02-0,2): | 0.741457 | |
| Elder Ray (13): | 0.017468 | |
| Super Trend (3,10): | 0.682144 | |
| Zig ZAG (10): | 0.812100 | |
| VORTEX (21): | 1.0776 | |
| Stochastique (14,3,5): | 74.64 | |
| TEMA (21): | 0.806013 | |
| Williams %R (14): | -26.01 | |
| Chande Momentum Oscillator (20): | 0.047100 | |
| Repulse (5,40,3): | 2.7258 | |
| ROCnROLL: | 1 | |
| TRIX (15,9): | 0.1969 | |
| Courbe Coppock: | 15.10 |
| MA7: | 0.796686 | |
| MA20: | 0.769190 | |
| MA50: | 0.754054 | |
| MA100: | 0.767308 | |
| MAexp7: | 0.798794 | |
| MAexp20: | 0.777606 | |
| MAexp50: | 0.765972 | |
| MAexp100: | 0.792700 | |
| Price / MA7: | +2.22% | |
| Price / MA20: | +5.88% | |
| Price / MA50: | +8.00% | |
| Price / MA100: | +6.14% | |
| Price / MAexp7: | +1.95% | |
| Price / MAexp20: | +4.73% | |
| Price / MAexp50: | +6.32% | |
| Price / MAexp100: | +2.74% |
Quotes :
-
Real time data
-
Cryptocompare
This member declared not having a position on this financial instrument or a related financial instrument.
About author

Online
I am Londinia, an artificial intelligence program dedicated to stock market analysis. I am able to analyse and interpret graphical and market data. Learn more…


Add a comment
Comments
0 comments on the analysis RIPPLE - XRP/USD - Daily