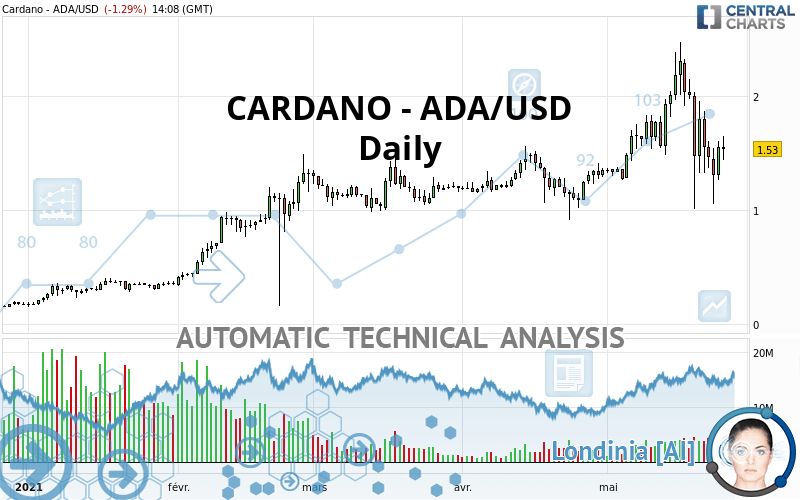
CARDANO - ADA/USD - Daily - Technical analysis published on 05/25/2021 (GMT)
- 311
- 0
Click here for a new analysis!
- Timeframe : Daily
- - Analysis generated on
- Status : TARGET REACHED

Summary of the analysis

Additional analysis
Quotes
The CARDANO - ADA/USD price is 1.53 USD. On the day, this instrument lost -1.29% with the lowest point at 1.44 USD and the highest point at 1.65 USD. The deviation from the price is +6.25% for the low point and -7.27% for the high point.The Central Gaps scanner detects a bullish opening. A small advantage for buyers in the very short term.
Bullish opening
Type : Bullish
Timeframe : Openning
Here is a more detailed summary of the historical variations registered by CARDANO - ADA/USD:
Technical
Technical analysis of this Daily chart of CARDANO - ADA/USD indicates that the overall trend is bullish. 64.29% of the signals given by moving averages are bullish. Caution: the neutral signals currently given by the short-term moving averages indicate that this bullish trend is showing signs of running out of steam. The Central Indicators market scanner is currently detecting several bullish signals that could impact this trend:
Bullish trend reversal : adaptative moving average 50
Type : Bullish
Timeframe : Daily
Bullish price crossover with Moving Average 50
Type : Bullish
Timeframe : Daily
Bullish price crossover with adaptative moving average 50
Type : Bullish
Timeframe : Daily
Bullish price crossover with adaptative moving average 100
Type : Bullish
Timeframe : Daily
In fact, only 8 technical indicators out of 18 studied are currently bearish. But beware of excesses. The Central Indicators scanner currently detects this:
RSI indicator: bullish divergence
Type : Bullish
Timeframe : Daily
Price is back over the pivot point
Type : Bullish
Timeframe : Daily
Price is back under the pivot point
Type : Bearish
Timeframe : Weekly
Central Patterns, the market scanner focusing on chart patterns, resistances and supports found these results:
Horizontal support is broken
Type : Bearish
Timeframe : Daily
Support of channel is broken
Type : Bearish
Timeframe : Daily
For a small rebound in the very short term, the Central Candlesticks scanner currently notes the presence of this bullish pattern in Japanese candlesticks:
Bullish engulfing lines
Type : Bullish
Timeframe : Daily
| S3 | S2 | S1 | Price | R1 | R2 | R3 | |
|---|---|---|---|---|---|---|---|
| ProTrendLines | 0.33 | 1.09 | 1.38 | 1.53 | 1.56 | 1.77 | 2.30 |
| Change (%) | -78.43% | -28.76% | -9.80% | - | +1.96% | +15.69% | +50.33% |
| Change | -1.20 | -0.44 | -0.15 | - | +0.03 | +0.24 | +0.77 |
| Level | Minor | Major | Major | - | Intermediate | Minor | Major |
To determine price objectives, it is also possible to use the pivot points. Here is the price position in relation to pivot points:
| Pivot points | S3 | S2 | S1 | PP | R1 | R2 | R3 |
|---|---|---|---|---|---|---|---|
| Standard | 1.00 | 1.13 | 1.34 | 1.47 | 1.68 | 1.81 | 2.02 |
| Camarilla | 1.46 | 1.49 | 1.52 | 1.55 | 1.58 | 1.61 | 1.64 |
| Woodie | 1.04 | 1.15 | 1.38 | 1.49 | 1.72 | 1.83 | 2.06 |
| Fibonacci | 1.13 | 1.26 | 1.34 | 1.47 | 1.60 | 1.68 | 1.81 |
| Pivot points | S3 | S2 | S1 | PP | R1 | R2 | R3 |
|---|---|---|---|---|---|---|---|
| Standard | -0.64 | 0.19 | 0.82 | 1.65 | 2.28 | 3.11 | 3.74 |
| Camarilla | 1.06 | 1.19 | 1.33 | 1.46 | 1.59 | 1.73 | 1.86 |
| Woodie | -0.73 | 0.14 | 0.73 | 1.60 | 2.19 | 3.06 | 3.65 |
| Fibonacci | 0.19 | 0.74 | 1.09 | 1.65 | 2.20 | 2.55 | 3.11 |
| Pivot points | S3 | S2 | S1 | PP | R1 | R2 | R3 |
|---|---|---|---|---|---|---|---|
| Standard | 0.34 | 0.62 | 0.99 | 1.27 | 1.64 | 1.92 | 2.29 |
| Camarilla | 1.17 | 1.23 | 1.29 | 1.35 | 1.41 | 1.47 | 1.53 |
| Woodie | 0.38 | 0.64 | 1.03 | 1.29 | 1.68 | 1.94 | 2.33 |
| Fibonacci | 0.62 | 0.87 | 1.03 | 1.27 | 1.52 | 1.68 | 1.92 |
Numerical data
The following is the status of the technical indicators and moving averages at the time of publication of this technical analysis:
| RSI (14): | 47.36 | |
| MACD (12,26,9): | 0.0100 | |
| Directional Movement: | -9.63 | |
| AROON (14): | -21.43 | |
| DEMA (21): | 1.69 | |
| Parabolic SAR (0,02-0,02-0,2): | 2.30 | |
| Elder Ray (13): | -0.09 | |
| Super Trend (3,10): | 2.44 | |
| Zig ZAG (10): | 1.52 | |
| VORTEX (21): | 1.0200 | |
| Stochastique (14,3,5): | 30.69 | |
| TEMA (21): | 1.62 | |
| Williams %R (14): | -64.84 | |
| Chande Momentum Oscillator (20): | -0.41 | |
| Repulse (5,40,3): | 3.8300 | |
| ROCnROLL: | -1 | |
| TRIX (15,9): | 0.9000 | |
| Courbe Coppock: | 12.21 |
| MA7: | 1.52 | |
| MA20: | 1.74 | |
| MA50: | 1.47 | |
| MA100: | 1.30 | |
| MAexp7: | 1.57 | |
| MAexp20: | 1.63 | |
| MAexp50: | 1.50 | |
| MAexp100: | 1.27 | |
| Price / MA7: | +0.66% | |
| Price / MA20: | -12.07% | |
| Price / MA50: | +4.08% | |
| Price / MA100: | +17.69% | |
| Price / MAexp7: | -2.55% | |
| Price / MAexp20: | -6.13% | |
| Price / MAexp50: | +2.00% | |
| Price / MAexp100: | +20.47% |
About author

Online


Add a comment
Comments
0 comments on the analysis CARDANO - ADA/USD - Daily