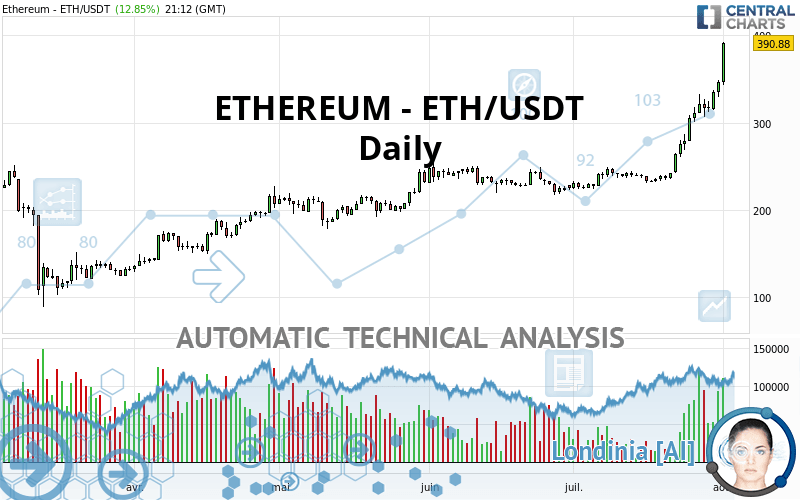
ETHEREUM - ETH/USDT - Daily - Technical analysis published on 08/01/2020 (GMT)
- Who voted?
- 185
- 0
Click here for a new analysis!
- Timeframe : Daily
- - Analysis generated on
- Status : TARGET REACHED

Summary of the analysis

Additional analysis
Quotes
The ETHEREUM - ETH/USDT price is 390.88 USDT. The price registered an increase of +12.85% on the session and was between 343.26 USDT and 392.28 USDT. This implies that the price is at +13.87% from its lowest and at -0.36% from its highest.The Central Gaps scanner detects a bearish opening. A small advantage for sellers in the very short term.
Bearish opening
Type : Bearish
Timeframe : Openning
So that you have an overall view of the price change, here is a table showing the variations over several periods:
New HIGH record (1 year)
Type : Bullish
Timeframe : Weekly
New HIGH record (1st january)
Type : Bullish
Timeframe : Weekly
New HIGH record (1 month)
Type : Bullish
Timeframe : Weekly
Technical
A technical analysis in Daily of this ETHEREUM - ETH/USDT chart shows a strongly bullish trend. 92.86% of the signals given by moving averages are bullish. This strongly bullish trend is supported by the strong bullish signals given by short-term moving averages. There is no crossing of moving average by the price or crossing of moving averages between themselves.
In fact, according to the parameters integrated into the Central Analyzer system, 17 technical indicators out of 18 analysed are currently bullish. But beware of excesses. The Central Indicators scanner currently detects this:
RSI indicator is overbought : over 80
Type : Neutral
Timeframe : Daily
CCI indicator is overbought : over 100
Type : Neutral
Timeframe : Daily
Williams %R indicator is overbought : over -20
Type : Neutral
Timeframe : Daily
Pivot points : price is over resistance 2
Type : Neutral
Timeframe : Weekly
Pivot points : price is over resistance 3
Type : Neutral
Timeframe : Daily
The Central Patterns scanner, which studies chart patterns, resistances and supports, has identified these signals:
Horizontal resistance is broken
Type : Bullish
Timeframe : Daily
Resistance of channel is broken
Type : Bullish
Timeframe : Daily
The Central Candlesticks scanner, specialised in Japanese candlesticks, did not identify any signals.
| S3 | S2 | S1 | Price | R1 | R2 | R3 | |
|---|---|---|---|---|---|---|---|
| ProTrendLines | 247.50 | 285.13 | 339.61 | 390.88 | 499.01 | 820.16 | 1,383.49 |
| Change (%) | -36.68% | -27.05% | -13.12% | - | +27.66% | +109.82% | +253.94% |
| Change | -143.38 | -105.75 | -51.27 | - | +108.13 | +429.28 | +992.61 |
| Level | Major | Major | Intermediate | - | Minor | Minor | Major |
To determine price objectives, it is also possible to use the pivot points. Here is the price position in relation to pivot points:
| Pivot points | S3 | S2 | S1 | PP | R1 | R2 | R3 |
|---|---|---|---|---|---|---|---|
| Standard | 313.30 | 321.07 | 333.73 | 341.50 | 354.16 | 361.93 | 374.59 |
| Camarilla | 340.76 | 342.63 | 344.51 | 346.38 | 348.25 | 350.13 | 352.00 |
| Woodie | 315.74 | 322.29 | 336.17 | 342.72 | 356.60 | 363.15 | 377.03 |
| Fibonacci | 321.07 | 328.88 | 333.70 | 341.50 | 349.31 | 354.13 | 361.93 |
| Pivot points | S3 | S2 | S1 | PP | R1 | R2 | R3 |
|---|---|---|---|---|---|---|---|
| Standard | 180.99 | 207.19 | 256.23 | 282.43 | 331.47 | 357.67 | 406.71 |
| Camarilla | 284.59 | 291.49 | 298.38 | 305.28 | 312.18 | 319.07 | 325.97 |
| Woodie | 192.42 | 212.90 | 267.66 | 288.14 | 342.90 | 363.38 | 418.14 |
| Fibonacci | 207.19 | 235.93 | 253.69 | 282.43 | 311.17 | 328.93 | 357.67 |
| Pivot points | S3 | S2 | S1 | PP | R1 | R2 | R3 |
|---|---|---|---|---|---|---|---|
| Standard | 137.56 | 180.49 | 263.43 | 306.36 | 389.30 | 432.23 | 515.17 |
| Camarilla | 311.77 | 323.30 | 334.84 | 346.38 | 357.92 | 369.46 | 380.99 |
| Woodie | 157.58 | 190.49 | 283.45 | 316.36 | 409.32 | 442.23 | 535.19 |
| Fibonacci | 180.49 | 228.57 | 258.27 | 306.36 | 354.44 | 384.14 | 432.23 |
Numerical data
The following is the status of the technical indicators and moving averages at the time of publication of this technical analysis:
| RSI (14): | 89.94 | |
| MACD (12,26,9): | 30.5900 | |
| Directional Movement: | 49.21 | |
| AROON (14): | 100.00 | |
| DEMA (21): | 330.27 | |
| Parabolic SAR (0,02-0,02-0,2): | 308.13 | |
| Elder Ray (13): | 53.04 | |
| Super Trend (3,10): | 310.45 | |
| Zig ZAG (10): | 385.61 | |
| VORTEX (21): | 1.3400 | |
| Stochastique (14,3,5): | 97.88 | |
| TEMA (21): | 351.42 | |
| Williams %R (14): | -1.57 | |
| Chande Momentum Oscillator (20): | 149.19 | |
| Repulse (5,40,3): | 21.3600 | |
| ROCnROLL: | 1 | |
| TRIX (15,9): | 1.1400 | |
| Courbe Coppock: | 81.53 |
| MA7: | 333.47 | |
| MA20: | 279.80 | |
| MA50: | 251.85 | |
| MA100: | 233.23 | |
| MAexp7: | 336.11 | |
| MAexp20: | 295.16 | |
| MAexp50: | 262.23 | |
| MAexp100: | 238.62 | |
| Price / MA7: | +17.22% | |
| Price / MA20: | +39.70% | |
| Price / MA50: | +55.20% | |
| Price / MA100: | +67.59% | |
| Price / MAexp7: | +16.30% | |
| Price / MAexp20: | +32.43% | |
| Price / MAexp50: | +49.06% | |
| Price / MAexp100: | +63.81% |
About author

Online


Add a comment
Comments
0 comments on the analysis ETHEREUM - ETH/USDT - Daily