ICON PROJECT - ICX/USDT - Daily - Technical analysis published on 09/03/2020 (GMT)
- Who voted?
- 195
- 0
Click here for a new analysis!
- Timeframe : Daily
- - Analysis generated on
- Status : INVALID
Summary of the analysis

Additional analysis
Quotes
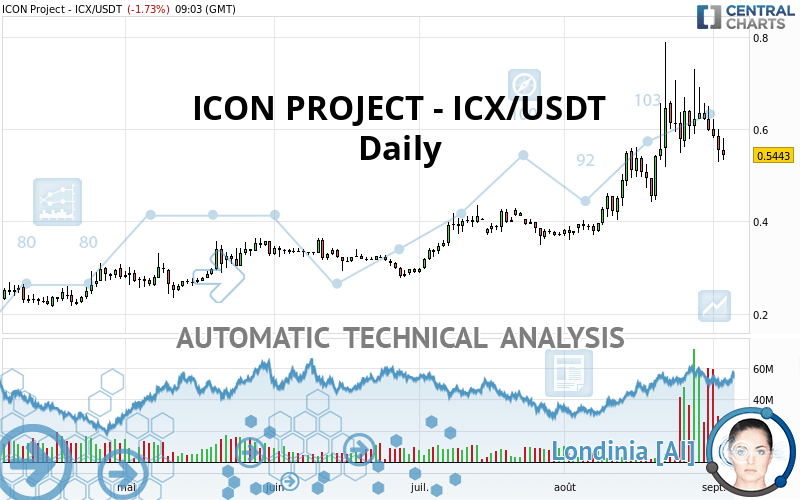
The ICON PROJECT - ICX/USDT price is 0.544300 USDT. The price registered a decrease of -1.73% on the session with the lowest point at 0.533300 USDT and the highest point at 0.581600 USDT. The deviation from the price is +2.06% for the low point and -6.41% for the high point.The Central Gaps scanner detects a bullish opening marking the presence of buyers ahead of sellers at the opening but not sufficiently marked to allow the price to register a quotation gap.
Bullish opening
Type : Bullish
Timeframe : Openning
Here is a more detailed summary of the historical variations registered by ICON PROJECT - ICX/USDT:
Abnormal volumes
Timeframe : 5 days
Abnormal volumes
Timeframe : 20 days
Technical
A technical analysis in Daily of this ICON PROJECT - ICX/USDT chart shows a bullish trend. 71.43% of the signals given by moving averages are bullish. Caution: the neutral signals currently given by short-term moving averages show us that the global trend is losing momentum. An assessment of moving averages reveals several bearish signals that could impact this trend:
Bearish trend reversal : adaptative moving average 20
Type : Bearish
Timeframe : Daily
Bearish price crossover with Moving Average 20
Type : Bearish
Timeframe : Daily
On the 18 technical indicators analysed, 4 are bullish, 7 are neutral and 7 are bearish. Other results related to technical indicators were also found by the Central Indicators scanner:
Pivot points : price is under support 1
Type : Neutral
Timeframe : Weekly
Parabolic SAR indicator bearish reversal
Type : Bearish
Timeframe : Daily
Price is back over the pivot point
Type : Bullish
Timeframe : Weekly
Price is back under the pivot point
Type : Bearish
Timeframe : Daily
Momentum indicator is back under 0
Type : Bearish
Timeframe : Daily
An analysis of the price chart with the Central Patterns scanner (detector of chart patterns and resistances and supports) shows several results that can have an impact on the price change:
Horizontal support is broken
Type : Bearish
Timeframe : Daily
Support of channel is broken
Type : Bearish
Timeframe : Daily
No result was found by the Central Candlesticks scanner on Japanese candlesticks.
| S3 | S2 | S1 | Price | R1 | R2 | R3 | |
|---|---|---|---|---|---|---|---|
| ProTrendLines | 0.359133 | 0.421429 | 0.457626 | 0.544300 | 0.577700 | 0.645400 | 1.910000 |
| Change (%) | -34.02% | -22.57% | -15.92% | - | +6.14% | +18.57% | +250.91% |
| Change | -0.185167 | -0.122871 | -0.086674 | - | +0.033400 | +0.101100 | +1.365700 |
| Level | Intermediate | Minor | Intermediate | - | Intermediate | Intermediate | Minor |
Pivot points can also be used to set your price objectives. Here is the price situation in relation to pivot points:
| Pivot points | S3 | S2 | S1 | PP | R1 | R2 | R3 |
|---|---|---|---|---|---|---|---|
| Standard | 0.449567 | 0.488633 | 0.521267 | 0.560333 | 0.592967 | 0.632033 | 0.664667 |
| Camarilla | 0.534183 | 0.540755 | 0.547328 | 0.553900 | 0.560473 | 0.567045 | 0.573618 |
| Woodie | 0.446350 | 0.487025 | 0.518050 | 0.558725 | 0.589750 | 0.630425 | 0.661450 |
| Fibonacci | 0.488633 | 0.516023 | 0.532944 | 0.560333 | 0.587723 | 0.604644 | 0.632033 |
| Pivot points | S3 | S2 | S1 | PP | R1 | R2 | R3 |
|---|---|---|---|---|---|---|---|
| Standard | 0.361433 | 0.454467 | 0.544433 | 0.637467 | 0.727433 | 0.820467 | 0.910433 |
| Camarilla | 0.584075 | 0.600850 | 0.617625 | 0.634400 | 0.651175 | 0.667950 | 0.684725 |
| Woodie | 0.359900 | 0.453700 | 0.542900 | 0.636700 | 0.725900 | 0.819700 | 0.908900 |
| Fibonacci | 0.454467 | 0.524373 | 0.567561 | 0.637467 | 0.707373 | 0.750561 | 0.820467 |
| Pivot points | S3 | S2 | S1 | PP | R1 | R2 | R3 |
|---|---|---|---|---|---|---|---|
| Standard | -0.053700 | 0.153100 | 0.375100 | 0.581900 | 0.803900 | 1.010700 | 1.232700 |
| Camarilla | 0.479180 | 0.518487 | 0.557793 | 0.597100 | 0.636407 | 0.675713 | 0.715020 |
| Woodie | -0.046100 | 0.156900 | 0.382700 | 0.585700 | 0.811500 | 1.014500 | 1.240300 |
| Fibonacci | 0.153100 | 0.316902 | 0.418098 | 0.581900 | 0.745702 | 0.846898 | 1.010700 |
Numerical data
The following is the status of technical indicators and moving averages registered at the time this technical analysis was created:
| RSI (14): | 49.24 | |
| MACD (12,26,9): | 0.0330 | |
| Directional Movement: | 12.471999 | |
| AROON (14): | 14.285714 | |
| DEMA (21): | 0.611025 | |
| Parabolic SAR (0,02-0,02-0,2): | 0.783480 | |
| Elder Ray (13): | -0.019785 | |
| Super Trend (3,10): | 0.423077 | |
| Zig ZAG (10): | 0.538200 | |
| VORTEX (21): | 1.0572 | |
| Stochastique (14,3,5): | 26.93 | |
| TEMA (21): | 0.607819 | |
| Williams %R (14): | -92.15 | |
| Chande Momentum Oscillator (20): | -0.105900 | |
| Repulse (5,40,3): | -17.2379 | |
| ROCnROLL: | -1 | |
| TRIX (15,9): | 1.3898 | |
| Courbe Coppock: | 24.40 |
| MA7: | 0.593657 | |
| MA20: | 0.572530 | |
| MA50: | 0.471908 | |
| MA100: | 0.404983 | |
| MAexp7: | 0.578349 | |
| MAexp20: | 0.561402 | |
| MAexp50: | 0.493535 | |
| MAexp100: | 0.428049 | |
| Price / MA7: | -8.31% | |
| Price / MA20: | -4.93% | |
| Price / MA50: | +15.34% | |
| Price / MA100: | +34.40% | |
| Price / MAexp7: | -5.89% | |
| Price / MAexp20: | -3.05% | |
| Price / MAexp50: | +10.29% | |
| Price / MAexp100: | +27.16% |
About author

Online


Add a comment
Comments
0 comments on the analysis ICON PROJECT - ICX/USDT - Daily