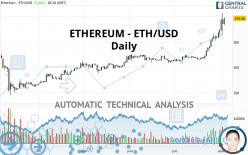
ETHEREUM - ETH/USD - Daily - Technical analysis published on 08/03/2020 (GMT)
- Who voted?
- 161
- 0
Click here for a new analysis!
- Timeframe : Daily
- - Analysis generated on
- Status : INVALID
Summary of the analysis

Additional analysis
Quotes
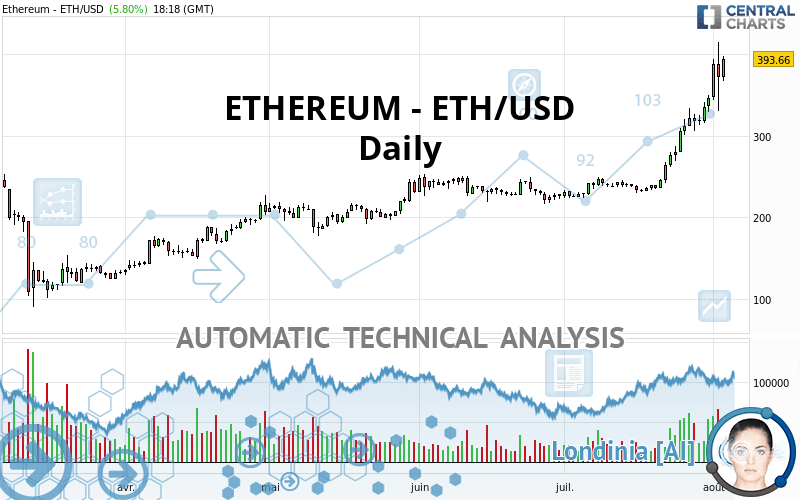
The ETHEREUM - ETH/USD price is 393.66 USD. The price has increased by +5.80% since the last closing and was traded between 367.49 USD and 398.08 USD over the period. The price is currently at +7.12% from its lowest and -1.11% from its highest.The Central Gaps scanner detects a bullish opening. A small advantage for buyers in the very short term.
Bullish opening
Type : Bullish
Timeframe : Openning
Here is a more detailed summary of the historical variations registered by ETHEREUM - ETH/USD:
Near a new HIGH record (1st january)
Type : Bullish
Timeframe : Weekly
Near a new HIGH record (1 month)
Type : Bullish
Timeframe : Weekly
Technical
Technical analysis of ETHEREUM - ETH/USD in Daily shows a strongly overall bullish trend. 92.86% of the signals given by moving averages are bullish. This strongly bullish trend is supported by the strong bullish signals given by short-term moving averages. There is no crossing of moving average by the price or crossing of moving averages between themselves.
An assessment of technical indicators shows a strong bullish signal.
Caution: the Central Indicators scanner currently detects an excess:
RSI indicator is overbought : over 80
Type : Neutral
Timeframe : Daily
CCI indicator is overbought : over 100
Type : Neutral
Timeframe : Daily
Previous candle closed over Bollinger bands
Type : Neutral
Timeframe : Daily
CCI indicator: bearish divergence
Type : Bearish
Timeframe : Daily
Williams %R indicator is overbought : over -20
Type : Neutral
Timeframe : Daily
Price is back over the pivot point
Type : Bullish
Timeframe : Weekly
Price is back under the pivot point
Type : Bearish
Timeframe : Daily
No signals are given by Central Patterns, a market scanner specialised in chart patterns, resistances and supports.
For a small setback in the very short term, the Central Candlesticks scanner currently notes the presence of this bearish pattern in Japanese candlesticks:
Bearish harami
Type : Bearish
Timeframe : Daily
Long black line
Type : Bearish
Timeframe : Daily
| S3 | S2 | S1 | Price | R1 | R2 | R3 | |
|---|---|---|---|---|---|---|---|
| ProTrendLines | 247.29 | 285.66 | 334.17 | 393.66 | 499.06 | 816.67 | 1,385.02 |
| Change (%) | -37.18% | -27.43% | -15.11% | - | +26.77% | +107.46% | +251.83% |
| Change | -146.37 | -108.00 | -59.49 | - | +105.40 | +423.01 | +991.36 |
| Level | Major | Intermediate | Intermediate | - | Minor | Minor | Major |
Pivot points can also be used to set your price objectives. Here is the price situation in relation to pivot points:
| Pivot points | S3 | S2 | S1 | PP | R1 | R2 | R3 |
|---|---|---|---|---|---|---|---|
| Standard | 244.85 | 287.46 | 329.77 | 372.38 | 414.69 | 457.30 | 499.61 |
| Camarilla | 348.72 | 356.50 | 364.29 | 372.07 | 379.85 | 387.64 | 395.42 |
| Woodie | 244.69 | 287.39 | 329.61 | 372.31 | 414.53 | 457.23 | 499.45 |
| Fibonacci | 287.46 | 319.90 | 339.94 | 372.38 | 404.82 | 424.86 | 457.30 |
| Pivot points | S3 | S2 | S1 | PP | R1 | R2 | R3 |
|---|---|---|---|---|---|---|---|
| Standard | 235.27 | 268.09 | 327.97 | 360.79 | 420.67 | 453.49 | 513.37 |
| Camarilla | 362.36 | 370.86 | 379.35 | 387.85 | 396.35 | 404.85 | 413.34 |
| Woodie | 248.80 | 274.86 | 341.50 | 367.56 | 434.20 | 460.26 | 526.90 |
| Fibonacci | 268.09 | 303.50 | 325.38 | 360.79 | 396.20 | 418.08 | 453.49 |
| Pivot points | S3 | S2 | S1 | PP | R1 | R2 | R3 |
|---|---|---|---|---|---|---|---|
| Standard | 136.75 | 179.96 | 263.36 | 306.57 | 389.97 | 433.18 | 516.58 |
| Camarilla | 311.95 | 323.56 | 335.16 | 346.77 | 358.38 | 369.98 | 381.59 |
| Woodie | 156.86 | 190.01 | 283.47 | 316.62 | 410.08 | 443.23 | 536.69 |
| Fibonacci | 179.96 | 228.32 | 258.20 | 306.57 | 354.93 | 384.81 | 433.18 |
Numerical data
The following are the details of the technical indicators and moving averages that were collected to generate this technical analysis:
| RSI (14): | 83.25 | |
| MACD (12,26,9): | 36.1900 | |
| Directional Movement: | 37.94 | |
| AROON (14): | 92.86 | |
| DEMA (21): | 354.05 | |
| Parabolic SAR (0,02-0,02-0,2): | 330.08 | |
| Elder Ray (13): | 50.60 | |
| Super Trend (3,10): | 309.66 | |
| Zig ZAG (10): | 395.26 | |
| VORTEX (21): | 1.3000 | |
| Stochastique (14,3,5): | 87.16 | |
| TEMA (21): | 377.92 | |
| Williams %R (14): | -11.00 | |
| Chande Momentum Oscillator (20): | 130.57 | |
| Repulse (5,40,3): | 15.3000 | |
| ROCnROLL: | 1 | |
| TRIX (15,9): | 1.4200 | |
| Courbe Coppock: | 93.26 |
| MA7: | 353.15 | |
| MA20: | 294.74 | |
| MA50: | 258.13 | |
| MA100: | 237.29 | |
| MAexp7: | 357.97 | |
| MAexp20: | 311.94 | |
| MAexp50: | 272.02 | |
| MAexp100: | 244.48 | |
| Price / MA7: | +11.47% | |
| Price / MA20: | +33.56% | |
| Price / MA50: | +52.50% | |
| Price / MA100: | +65.90% | |
| Price / MAexp7: | +9.97% | |
| Price / MAexp20: | +26.20% | |
| Price / MAexp50: | +44.72% | |
| Price / MAexp100: | +61.02% |
About author

Online


Add a comment
Comments
0 comments on the analysis ETHEREUM - ETH/USD - Daily