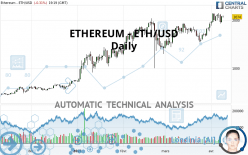
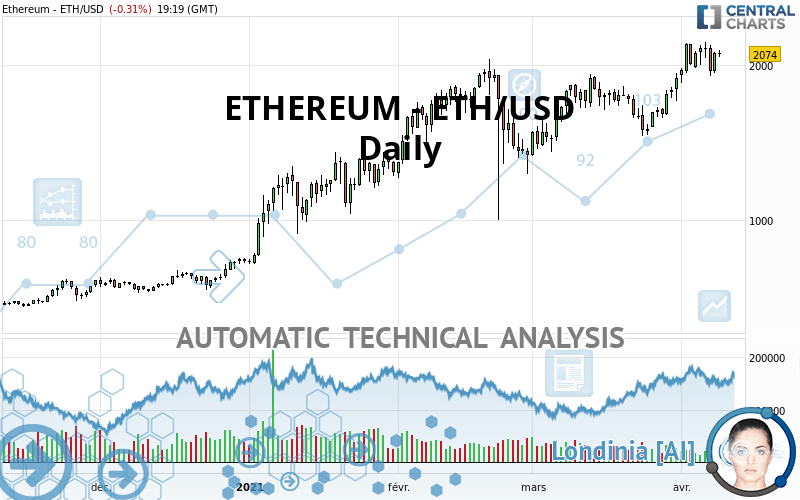
ETHEREUM - ETH/USD - Daily - Technical analysis published on 04/09/2021 (GMT)
- 242
- 0
Click here for a new analysis!
- Timeframe : Daily
- - Analysis generated on
- Status : TARGET REACHED
Summary of the analysis

Additional analysis
Quotes
The ETHEREUM - ETH/USD price is 2,074.00 USD. The price is lower by -0.31% since the last closing and was between 2,050.00 USD and 2,100.65 USD. This implies that the price is at +1.17% from its lowest and at -1.27% from its highest.A bullish opening was detected by the Central Gaps scanner. Buyers are trying to impose a bullish momentum in the very short term.
Bullish opening
Type : Bullish
Timeframe : Openning
A study of price movements over other periods shows the following variations:
New HIGH record (5 years)
Type : Bullish
Timeframe : Weekly
Near a new HIGH record (1st january)
Type : Bullish
Timeframe : Weekly
Near a new HIGH record (1 month)
Type : Bullish
Timeframe : Weekly
Technical
Technical analysis of this Daily chart of ETHEREUM - ETH/USD indicates that the overall trend is strongly bullish. 92.86% of the signals given by moving averages are bullish. This strongly bullish trend is supported by the strong bullish signals given by short-term moving averages. The Central Indicators scanner does not detect any result on moving averages that would impact this trend.
Technical indicators are strongly bullish, suggesting that the price increase should continue.
But beware of excesses. The Central Indicators scanner currently detects this:
RSI indicator: bearish divergence
Type : Bearish
Timeframe : Daily
Pivot points : price is over resistance 3
Type : Neutral
Timeframe : Daily
Pivot points : price is over resistance 3
Type : Neutral
Timeframe : Weekly
Pivot points : price is under support 3
Type : Neutral
Timeframe : Daily
Pivot points : price is under support 3
Type : Neutral
Timeframe : Weekly
Central Patterns, the market scanner focusing on chart patterns, resistances and supports found this result:
Resistance of channel is broken
Type : Bullish
Timeframe : Daily
For a small rebound in the very short term, the Central Candlesticks scanner currently notes the presence of this bullish pattern in Japanese candlesticks:
Bullish harami
Type : Bullish
Timeframe : Daily
| S3 | S2 | S1 | Price | R1 | |
|---|---|---|---|---|---|
| ProTrendLines | 1,108.06 | 1,580.78 | 1,957.79 | 2,074.00 | 2,134.14 |
| Change (%) | -46.57% | -23.78% | -5.60% | - | +2.90% |
| Change | -965.94 | -493.22 | -116.21 | - | +60.14 |
| Level | Minor | Major | Major | - | Major |
Pivot points can also be used to set your price objectives. Here is the price situation in relation to pivot points:
| Pivot points | S3 | S2 | S1 | PP | R1 | R2 | R3 |
|---|---|---|---|---|---|---|---|
| Standard | 1,857.69 | 1,903.85 | 1,992.15 | 2,038.31 | 2,126.61 | 2,172.77 | 2,261.07 |
| Camarilla | 2,043.48 | 2,055.81 | 2,068.14 | 2,080.46 | 2,092.79 | 2,105.11 | 2,117.44 |
| Woodie | 1,878.77 | 1,914.39 | 2,013.23 | 2,048.85 | 2,147.69 | 2,183.31 | 2,282.15 |
| Fibonacci | 1,903.85 | 1,955.21 | 1,986.94 | 2,038.31 | 2,089.67 | 2,121.40 | 2,172.77 |
| Pivot points | S3 | S2 | S1 | PP | R1 | R2 | R3 |
|---|---|---|---|---|---|---|---|
| Standard | 1,251.69 | 1,456.80 | 1,733.78 | 1,938.89 | 2,215.87 | 2,420.98 | 2,697.96 |
| Camarilla | 1,878.20 | 1,922.39 | 1,966.58 | 2,010.77 | 2,054.96 | 2,099.15 | 2,143.35 |
| Woodie | 1,287.64 | 1,474.77 | 1,769.73 | 1,956.86 | 2,251.82 | 2,438.95 | 2,733.91 |
| Fibonacci | 1,456.80 | 1,640.96 | 1,754.73 | 1,938.89 | 2,123.05 | 2,236.82 | 2,420.98 |
| Pivot points | S3 | S2 | S1 | PP | R1 | R2 | R3 |
|---|---|---|---|---|---|---|---|
| Standard | 1,037.67 | 1,225.84 | 1,571.62 | 1,759.79 | 2,105.57 | 2,293.74 | 2,639.52 |
| Camarilla | 1,770.56 | 1,819.51 | 1,868.46 | 1,917.40 | 1,966.35 | 2,015.29 | 2,064.24 |
| Woodie | 1,116.48 | 1,265.24 | 1,650.43 | 1,799.19 | 2,184.38 | 2,333.14 | 2,718.33 |
| Fibonacci | 1,225.84 | 1,429.81 | 1,555.82 | 1,759.79 | 1,963.76 | 2,089.77 | 2,293.74 |
Numerical data
The following are the details of the technical indicators and moving averages that were collected to generate this technical analysis:
| RSI (14): | 60.76 | |
| MACD (12,26,9): | 95.6900 | |
| Directional Movement: | 7.22 | |
| AROON (14): | 78.57 | |
| DEMA (21): | 2,051.46 | |
| Parabolic SAR (0,02-0,02-0,2): | 1,797.08 | |
| Elder Ray (13): | 88.01 | |
| Super Trend (3,10): | 1,734.67 | |
| Zig ZAG (10): | 2,076.73 | |
| VORTEX (21): | 1.1200 | |
| Stochastique (14,3,5): | 80.14 | |
| TEMA (21): | 2,096.92 | |
| Williams %R (14): | -15.06 | |
| Chande Momentum Oscillator (20): | 390.59 | |
| Repulse (5,40,3): | 2.8400 | |
| ROCnROLL: | 1 | |
| TRIX (15,9): | 0.6100 | |
| Courbe Coppock: | 44.03 |
| MA7: | 2,061.01 | |
| MA20: | 1,875.41 | |
| MA50: | 1,777.27 | |
| MA100: | 1,579.07 | |
| MAexp7: | 2,042.58 | |
| MAexp20: | 1,935.68 | |
| MAexp50: | 1,788.06 | |
| MAexp100: | 1,555.19 | |
| Price / MA7: | +0.63% | |
| Price / MA20: | +10.59% | |
| Price / MA50: | +16.70% | |
| Price / MA100: | +31.34% | |
| Price / MAexp7: | +1.54% | |
| Price / MAexp20: | +7.15% | |
| Price / MAexp50: | +15.99% | |
| Price / MAexp100: | +33.36% |
About author

Online


Add a comment
Comments
0 comments on the analysis ETHEREUM - ETH/USD - Daily