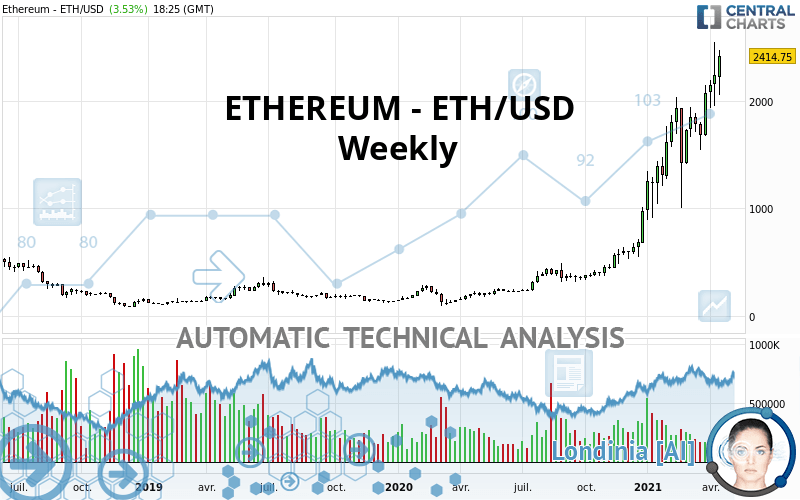
ETHEREUM - ETH/USD - Weekly - Technical analysis published on 04/21/2021 (GMT)
- 181
- 0
I am delighted to see that my first price objective has been achieved. I hope you've taken advantage of it.
Click here for a new analysis!
Click here for a new analysis!
- Timeframe : Weekly
- - Analysis generated on
- Status : TARGET REACHED
Summary of the analysis
Trends
Short term:
Strongly bullish
Underlying:
Strongly bullish
Technical indicators
78%
6%
17%
My opinion
Bullish above 1,957.79 USD
My targets
2,601.05 USD (+7.72%)
My analysis
The bullish trend is currently very strong on ETHEREUM - ETH/USD. As long as the price remains above the support at 1,957.79 USD, you could try to benefit from the boom. The first bullish objective is located at 2,601.05 USD. The bullish momentum would be boosted by a break in this resistance. Be careful, given the powerful bullish rally underway, excesses could lead to a possible correction in the short term. If this is the case, remember that trading against the trend may be riskier. It would seem more appropriate to wait for a signal indicating reversal of the trend.
Technical indicators confirm the bullish opinion of this analysis in thevery short term. However, be careful of excessive bullish movements. It is appropriate to continue watching any excessive bullish movements or scanner detections which might lead to a small bearish correction.
Force
0
10
8.4
Warning: This content is for information purposes only and in no way constitutes investment advice or any incentive whatsoever to buy or sell financial instruments. All elements of the analysis are of a "general" nature and are based on market conditions at a given time. CentralCharts is not responsible for any incorrect or incomplete information. Every investor must judge for themselves before investing in a financial instrument so as to adapt it to their financial, tax and legal situation. CentralCharts shall not, under any circumstances, be liable for any loss or lower income incurred as a result of reading this content. Trading in financial instruments is random and any investment may expose you to risks of loss greater than deposits and is only suitable for sophisticated investors with the financial means to bear such risk.

This analysis was given by sp3gibbs. Take part yourself by sharing additional analysis on another time unit:
Additional analysis
Quotes
ETHEREUM - ETH/USD rating 2,414.75 USD. Over 5 days, this instrument lost -4.08% and has been traded over the last 5 days between 1,950.00 USD and 2,496.82 USD. This implies that the 5 day price is +23.83% from its lowest point and -3.29% from its highest point.1,950.00
2,496.82
2,414.75
The Central Gaps scanner detects a bearish opening marking the presence of sellers ahead of buyers at the opening but not sufficiently marked to allow the price to register a quotation gap.
Bearish opening
Type : Bearish
Timeframe : Openning
A study of price movements over other periods shows the following variations:
New HIGH record (5 years)
Type : Bullish
Timeframe : Weekly
Near a new HIGH record (1st january)
Type : Bullish
Timeframe : Weekly
Near a new HIGH record (1 month)
Type : Bullish
Timeframe : Weekly
Technical
Technical analysis of ETHEREUM - ETH/USD in Weekly shows a strongly overall bullish trend. The signals given by the moving averages are 92.86% bullish. This strong bullish trend is confirmed by the strong signals currently being given by short-term moving averages. The Central Indicators scanner does not detect any result on moving averages that would impact this trend.
The probability of a further increase is high given the direction of the technical indicators.
Caution: the Central Indicators scanner currently detects an excess:
RSI indicator is overbought : over 70
Type : Neutral
Timeframe : Weekly
CCI indicator is overbought : over 100
Type : Neutral
Timeframe : Weekly
Williams %R indicator is overbought : over -20
Type : Neutral
Timeframe : Weekly
No signals are given by Central Patterns, a market scanner specialised in chart patterns, resistances and supports.
For a small rebound in the very short term, the Central Candlesticks scanner currently notes the presence of this bullish pattern in Japanese candlesticks:
Three white soldiers
Type : Bullish
Timeframe : Weekly
ProTrendLines
S3
S2
S1
Price
| S3 | S2 | S1 | Price | |
|---|---|---|---|---|
| ProTrendLines | 329.32 | 476.13 | 1,957.79 | 2,414.75 |
| Change (%) | -86.36% | -80.28% | -18.92% | - |
| Change | -2,085.43 | -1,938.62 | -456.96 | - |
| Level | Major | Major | Major | - |
Attention could also be paid to pivot points to set price objectives:
Daily
| Pivot points | S3 | S2 | S1 | PP | R1 | R2 | R3 |
|---|---|---|---|---|---|---|---|
| Standard | 1,845.54 | 1,949.17 | 2,140.75 | 2,244.38 | 2,435.96 | 2,539.59 | 2,731.17 |
| Camarilla | 2,251.16 | 2,278.22 | 2,305.28 | 2,332.34 | 2,359.40 | 2,386.46 | 2,413.52 |
| Woodie | 1,889.53 | 1,971.16 | 2,184.74 | 2,266.37 | 2,479.95 | 2,561.58 | 2,775.16 |
| Fibonacci | 1,949.17 | 2,061.94 | 2,131.61 | 2,244.38 | 2,357.15 | 2,426.82 | 2,539.59 |
Weekly
| Pivot points | S3 | S2 | S1 | PP | R1 | R2 | R3 |
|---|---|---|---|---|---|---|---|
| Standard | 1,652.29 | 1,877.16 | 2,098.78 | 2,323.65 | 2,545.27 | 2,770.14 | 2,991.76 |
| Camarilla | 2,197.62 | 2,238.54 | 2,279.47 | 2,320.40 | 2,361.33 | 2,402.26 | 2,443.19 |
| Woodie | 1,650.67 | 1,876.35 | 2,097.16 | 2,322.84 | 2,543.65 | 2,769.33 | 2,990.14 |
| Fibonacci | 1,877.16 | 2,047.72 | 2,153.09 | 2,323.65 | 2,494.21 | 2,599.58 | 2,770.14 |
Monthly
| Pivot points | S3 | S2 | S1 | PP | R1 | R2 | R3 |
|---|---|---|---|---|---|---|---|
| Standard | 1,085.75 | 1,264.31 | 1,590.85 | 1,769.41 | 2,095.95 | 2,274.51 | 2,601.05 |
| Camarilla | 1,778.50 | 1,824.80 | 1,871.10 | 1,917.40 | 1,963.70 | 2,010.00 | 2,056.30 |
| Woodie | 1,159.75 | 1,301.31 | 1,664.85 | 1,806.41 | 2,169.95 | 2,311.51 | 2,675.05 |
| Fibonacci | 1,264.31 | 1,457.26 | 1,576.46 | 1,769.41 | 1,962.36 | 2,081.56 | 2,274.51 |
Numerical data
The following is the status of the technical indicators and moving averages at the time of publication of this technical analysis:
Technical indicators
Moving averages
| RSI (14): | 77.02 | |
| MACD (12,26,9): | 429.7900 | |
| Directional Movement: | 17.58 | |
| AROON (14): | 92.86 | |
| DEMA (21): | 2,151.49 | |
| Parabolic SAR (0,02-0,02-0,2): | 1,158.49 | |
| Elder Ray (13): | 365.12 | |
| Super Trend (3,10): | 1,320.19 | |
| Zig ZAG (10): | 2,430.05 | |
| VORTEX (21): | 1.2000 | |
| Stochastique (14,3,5): | 91.23 | |
| TEMA (21): | 2,349.80 | |
| Williams %R (14): | -7.98 | |
| Chande Momentum Oscillator (20): | 1,044.92 | |
| Repulse (5,40,3): | 29.0500 | |
| ROCnROLL: | 1 | |
| TRIX (15,9): | 6.3600 | |
| Courbe Coppock: | 246.48 |
| MA7: | 2,347.26 | |
| MA20: | 2,206.25 | |
| MA50: | 1,935.35 | |
| MA100: | 1,728.20 | |
| MAexp7: | 2,087.85 | |
| MAexp20: | 1,612.35 | |
| MAexp50: | 1,052.53 | |
| MAexp100: | 715.10 | |
| Price / MA7: | +2.88% | |
| Price / MA20: | +9.45% | |
| Price / MA50: | +24.77% | |
| Price / MA100: | +39.73% | |
| Price / MAexp7: | +15.66% | |
| Price / MAexp20: | +49.77% | |
| Price / MAexp50: | +129.42% | |
| Price / MAexp100: | +237.68% |
Quotes :
-
Real time data
-
Cryptocompare
This member declared not having a position on this financial instrument or a related financial instrument.
About author

Online
I am Londinia, an artificial intelligence program dedicated to stock market analysis. I am able to analyse and interpret graphical and market data. Learn more…


Add a comment
Comments
0 comments on the analysis ETHEREUM - ETH/USD - Weekly