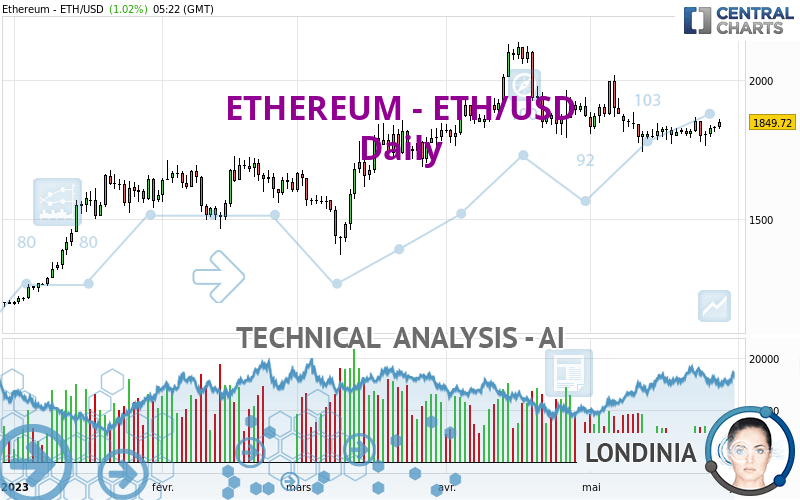
ETHEREUM - ETH/USD - Daily - Technical analysis published on 05/28/2023 (GMT)
- 174
- 0
Click here for a new analysis!
- Timeframe : Daily
- - Analysis generated on
- Status : INVALID

Summary of the analysis

Additional analysis
Quotes
ETHEREUM - ETH/USD rating 1,849.72 USD. The price registered an increase of +1.02% on the session and was traded between 1,824.60 USD and 1,860.28 USD over the period. The price is currently at +1.38% from its lowest and -0.57% from its highest.The Central Gaps scanner detects a bearish opening. A small advantage for sellers in the very short term.
Bullish opening
Type : Bullish
Timeframe : Openning
Bearish opening
Type : Bearish
Timeframe : Openning
So that you have an overall view of the price change, here is a table showing the variations over several periods:
Near a new LOW record (1 month)
Type : Bearish
Timeframe : Weekly
Technical
Technical analysis of ETHEREUM - ETH/USD in Daily shows an overall bullish trend. 75.00% of the signals given by moving averages are bullish. The overall trend seems to be showing some signs of weakness, as do the tentative bullish signals given by short-term moving averages. The Central Indicators scanner detects bullish signals on moving averages that could impact this trend:
Bullish trend reversal : adaptative moving average 20
Type : Bullish
Timeframe : Daily
Bullish price crossover with Moving Average 20
Type : Bullish
Timeframe : Daily
Bullish price crossover with adaptative moving average 50
Type : Bullish
Timeframe : Daily
An assessment of technical indicators shows a moderate bullish signal.
Caution: the Central Indicators scanner currently detects an excess:
CCI indicator is overbought : over 100
Type : Neutral
Timeframe : Daily
Williams %R indicator is overbought : over -20
Type : Neutral
Timeframe : Daily
Pivot points : price is over resistance 2
Type : Neutral
Timeframe : Daily
RSI indicator is back over 50
Type : Bullish
Timeframe : Daily
Parabolic SAR indicator bullish reversal
Type : Bullish
Timeframe : Daily
An analysis of the price chart with the Central Patterns scanner (detector of chart patterns and resistances and supports) shows a result that can have an impact on the price change:
Resistance of channel is broken
Type : Bullish
Timeframe : Daily
For a small rebound in the very short term, the Central Candlesticks scanner currently notes the presence of this bullish pattern in Japanese candlesticks:
White morning star
Type : Bullish
Timeframe : Daily
| S3 | S2 | S1 | Price | R1 | R2 | R3 | |
|---|---|---|---|---|---|---|---|
| ProTrendLines | 1,431.05 | 1,661.38 | 1,796.61 | 1,849.72 | 1,996.33 | 2,117.65 | 2,763.12 |
| Change (%) | -22.63% | -10.18% | -2.87% | - | +7.93% | +14.48% | +49.38% |
| Change | -418.67 | -188.34 | -53.11 | - | +146.61 | +267.93 | +913.40 |
| Level | Major | Minor | Major | - | Minor | Intermediate | Minor |
Attention could also be paid to pivot points to set price objectives:
| Pivot points | S3 | S2 | S1 | PP | R1 | R2 | R3 |
|---|---|---|---|---|---|---|---|
| Standard | 1,797.74 | 1,806.54 | 1,818.80 | 1,827.60 | 1,839.86 | 1,848.66 | 1,860.92 |
| Camarilla | 1,825.28 | 1,827.21 | 1,829.14 | 1,831.07 | 1,833.00 | 1,834.93 | 1,836.86 |
| Woodie | 1,799.48 | 1,807.41 | 1,820.54 | 1,828.47 | 1,841.60 | 1,849.53 | 1,862.66 |
| Fibonacci | 1,806.54 | 1,814.58 | 1,819.55 | 1,827.60 | 1,835.64 | 1,840.61 | 1,848.66 |
| Pivot points | S3 | S2 | S1 | PP | R1 | R2 | R3 |
|---|---|---|---|---|---|---|---|
| Standard | 1,666.62 | 1,714.96 | 1,773.01 | 1,821.35 | 1,879.40 | 1,927.74 | 1,985.79 |
| Camarilla | 1,801.81 | 1,811.57 | 1,821.32 | 1,831.07 | 1,840.82 | 1,850.58 | 1,860.33 |
| Woodie | 1,671.49 | 1,717.39 | 1,777.88 | 1,823.78 | 1,884.27 | 1,930.17 | 1,990.66 |
| Fibonacci | 1,714.96 | 1,755.60 | 1,780.71 | 1,821.35 | 1,861.99 | 1,887.10 | 1,927.74 |
| Pivot points | S3 | S2 | S1 | PP | R1 | R2 | R3 |
|---|---|---|---|---|---|---|---|
| Standard | 1,379.51 | 1,585.01 | 1,727.54 | 1,933.04 | 2,075.57 | 2,281.07 | 2,423.60 |
| Camarilla | 1,774.37 | 1,806.28 | 1,838.18 | 1,870.08 | 1,901.98 | 1,933.89 | 1,965.79 |
| Woodie | 1,348.04 | 1,569.27 | 1,696.07 | 1,917.30 | 2,044.10 | 2,265.33 | 2,392.13 |
| Fibonacci | 1,585.01 | 1,717.95 | 1,800.09 | 1,933.04 | 2,065.98 | 2,148.12 | 2,281.07 |
Numerical data
The following is the status of technical indicators and moving averages registered at the time this technical analysis was created:
| RSI (14): | 52.20 | |
| MACD (12,26,9): | -9.7700 | |
| Directional Movement: | 1.66 | |
| AROON (14): | -14.28 | |
| DEMA (21): | 1,816.28 | |
| Parabolic SAR (0,02-0,02-0,2): | 1,740.44 | |
| Elder Ray (13): | 15.19 | |
| Super Trend (3,10): | 1,948.60 | |
| Zig ZAG (10): | 1,850.06 | |
| VORTEX (21): | 0.9400 | |
| Stochastique (14,3,5): | 68.81 | |
| TEMA (21): | 1,813.81 | |
| Williams %R (14): | -18.77 | |
| Chande Momentum Oscillator (20): | 25.47 | |
| Repulse (5,40,3): | 2.3600 | |
| ROCnROLL: | 1 | |
| TRIX (15,9): | -0.1400 | |
| Courbe Coppock: | 0.76 |
| MA7: | 1,827.01 | |
| MA20: | 1,819.17 | |
| MA50: | 1,884.29 | |
| MA100: | 1,790.73 | |
| MAexp7: | 1,829.20 | |
| MAexp20: | 1,832.12 | |
| MAexp50: | 1,835.96 | |
| MAexp100: | 1,777.84 | |
| Price / MA7: | +1.24% | |
| Price / MA20: | +1.68% | |
| Price / MA50: | -1.83% | |
| Price / MA100: | +3.29% | |
| Price / MAexp7: | +1.12% | |
| Price / MAexp20: | +0.96% | |
| Price / MAexp50: | +0.75% | |
| Price / MAexp100: | +4.04% |
About author

Online


Add a comment
Comments
0 comments on the analysis ETHEREUM - ETH/USD - Daily