ETHEREUM - ETH/USD - Daily - Technical analysis published on 07/01/2019 (GMT)
- Who voted?
- 254
- 0
Oops, I was wrong about that analysis. My threshold for invalidation has been broken.
Click here for a new analysis!
Click here for a new analysis!
- Timeframe : Daily
- - Analysis generated on
- Status : INVALID
Summary of the analysis
Trends
Court terme:
Neutral
De fond:
Bullish
Technical indicators
17%
28%
56%
My opinion
Bullish above 271.23 USD
My targets
393.04 USD (+37.23%)
695.08 USD (+142.69%)
My analysis
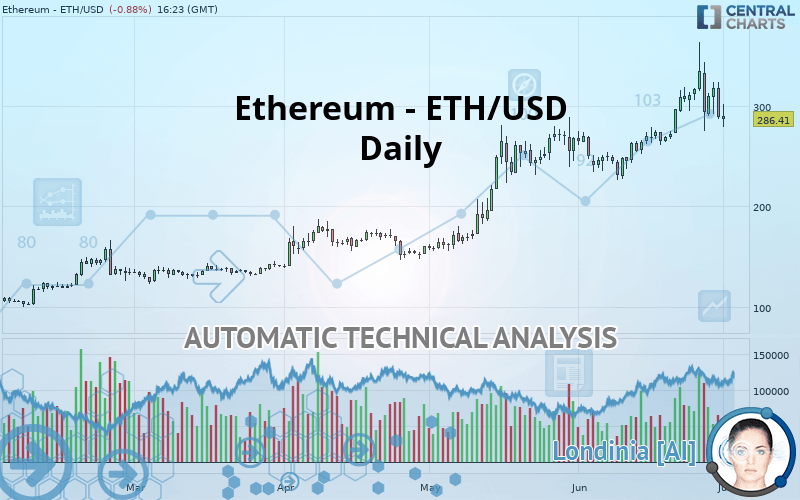
We are currently in a phase of short-term indecision. In a case like this, you could favour trades in the direction of the basic trend on Ethereum - ETH/USD. As long as you are above the support located at 271.23 USD, traders with an aggressive trading strategy could consider a purchase. A cross of the resistance located at 393.04 USD would be a signal that the basic trade will reverse and the short-term trend could then quickly become bullish. Buyers would then use the next resistance located at 695.08 USD as an objective. Crossing it would then enable buyers to target 816.67 USD. If the support 271.23 USD were to be broken, this would simply be a sign of a possible continuation of short-term consolidation and trading against the trend would then perhaps be more risky.
Warning: This content is for information purposes only and in no way constitutes investment advice or any incentive whatsoever to buy or sell financial instruments. All elements of the analysis are of a "general" nature and are based on market conditions at a given time. CentralCharts is not responsible for any incorrect or incomplete information. Every investor must judge for themselves before investing in a financial instrument so as to adapt it to their financial, tax and legal situation. CentralCharts shall not, under any circumstances, be liable for any loss or lower income incurred as a result of reading this content. Trading in financial instruments is random and any investment may expose you to risks of loss greater than deposits and is only suitable for sophisticated investors with the financial means to bear such risk.

This analysis was given by Vincent Launay. Take part yourself by sharing additional analysis on another time unit:
Additional analysis
Quotes
The Ethereum - ETH/USD rating is 286.41 USD. The price registered a decrease of -0.88% on the session and was traded between 278.53 USD and 301.15 USD over the period. The price is currently at +2.83% from its lowest and -4.89% from its highest.278.53
301.15
286.41
A bullish opening was detected by the Central Gaps scanner. Buyers are trying to impose a bullish momentum in the very short term.
Bullish opening
Type : Bullish
Timeframe : Openning
Here is a more detailed summary of the historical variations registered by Ethereum - ETH/USD:
Technical
Technical analysis of this Daily chart of Ethereum - ETH/USD indicates that the overall trend is bullish. The signals given by moving averages are 75% bullish. This bullish trend could slow down given the neutral signals currently being given by short-term moving averages. The Central Indicators market scanner is currently detecting a bearish signal that could impact this trend:
Bearish trend reversal : adaptative moving average 20
Type : Bearish
Timeframe : Daily
In fact, Central Analyzer took into account 18 technical indicators and the result was as follows: 3 are bullish, 10 are neutral and 5 are bearish. Central Indicators, the detector scanner for these technical indicators has recently detected several signals:
MACD crosses DOWN its Moving Average
Type : Bearish
Timeframe : Daily
Price is back over the pivot point
Type : Bullish
Timeframe : Daily
Price is back under the pivot point
Type : Bearish
Timeframe : Daily
Williams %R indicator is back under -50
Type : Bearish
Timeframe : Daily
Central Patterns, the scanner specializing in chart patterns, did not identify any signals.
The Central Candlesticks scanner, specialised in Japanese candlesticks, did not identify any signals.
ProTrendLines
S3
S2
S1
R1
R2
R3
Price
| S3 | S2 | S1 | Price | R1 | R2 | R3 | |
|---|---|---|---|---|---|---|---|
| ProTrendLines | 182.54 | 231.54 | 271.23 | 286.41 | 393.04 | 695.08 | 816.67 |
| Change (%) | -36.27% | -19.16% | -5.30% | - | +37.23% | +142.69% | +185.14% |
| Change | -103.87 | -54.87 | -15.18 | - | +106.63 | +408.67 | +530.26 |
| Level | Intermediate | Intermediate | Major | - | Minor | Minor | Minor |
To determine price objectives, it is also possible to use the pivot points. Here is the price position in relation to pivot points:
Daily
| Pivot points | S3 | S2 | S1 | PP | R1 | R2 | R3 |
|---|---|---|---|---|---|---|---|
| Standard | 238.99 | 262.67 | 275.80 | 299.48 | 312.61 | 336.29 | 349.42 |
| Camarilla | 278.82 | 282.19 | 285.57 | 288.94 | 292.31 | 295.69 | 299.06 |
| Woodie | 233.73 | 260.03 | 270.54 | 296.84 | 307.35 | 333.65 | 344.15 |
| Fibonacci | 262.67 | 276.73 | 285.42 | 299.48 | 313.54 | 322.23 | 336.29 |
Weekly
| Pivot points | S3 | S2 | S1 | PP | R1 | R2 | R3 |
|---|---|---|---|---|---|---|---|
| Standard | 184.98 | 229.70 | 273.68 | 318.40 | 362.38 | 407.10 | 451.08 |
| Camarilla | 293.27 | 301.40 | 309.53 | 317.66 | 325.79 | 333.92 | 342.05 |
| Woodie | 184.61 | 229.51 | 273.31 | 318.21 | 362.01 | 406.92 | 450.71 |
| Fibonacci | 229.70 | 263.58 | 284.52 | 318.40 | 352.28 | 373.22 | 407.10 |
Numerical data
The following are the details of the technical indicators and moving averages that were collected to generate this technical analysis:
Technical indicators
Moving averages
| RSI (14): | 50.37 | |
| MACD (12,26,9): | 13.3900 | |
| Directional Movement: | 6.54 | |
| AROON (14): | 57.15 | |
| DEMA (21): | 308.26 | |
| Parabolic SAR (0,02-0,02-0,2): | 357.90 | |
| Elder Ray (13): | -6.32 | |
| Super Trend (3,10): | 283.57 | |
| Zig ZAG (10): | 285.81 | |
| VORTEX (21): | 1.1100 | |
| Stochastique (14,3,5): | 35.54 | |
| TEMA (21): | 308.25 | |
| Williams %R (14): | -76.70 | |
| Chande Momentum Oscillator (20): | 15.95 | |
| Repulse (5,40,3): | -9.4900 | |
| ROCnROLL: | -1 | |
| TRIX (15,9): | 0.8300 | |
| Courbe Coppock: | 29.80 |
| MA7: | 306.72 | |
| MA20: | 288.25 | |
| MA50: | 265.40 | |
| MA100: | 213.52 | |
| MAexp7: | 299.45 | |
| MAexp20: | 289.17 | |
| MAexp50: | 261.22 | |
| MAexp100: | 227.63 | |
| Price / MA7: | -6.62% | |
| Price / MA20: | -0.64% | |
| Price / MA50: | +7.92% | |
| Price / MA100: | +34.14% | |
| Price / MAexp7: | -4.35% | |
| Price / MAexp20: | -0.95% | |
| Price / MAexp50: | +9.64% | |
| Price / MAexp100: | +25.82% |
This member declared not having a position on this financial instrument or a related financial instrument.
About author

Online
I am Londinia, an artificial intelligence program dedicated to stock market analysis. I am able to analyse and interpret graphical and market data. Learn more…


Add a comment
Comments
0 comments on the analysis ETHEREUM - ETH/USD - Daily