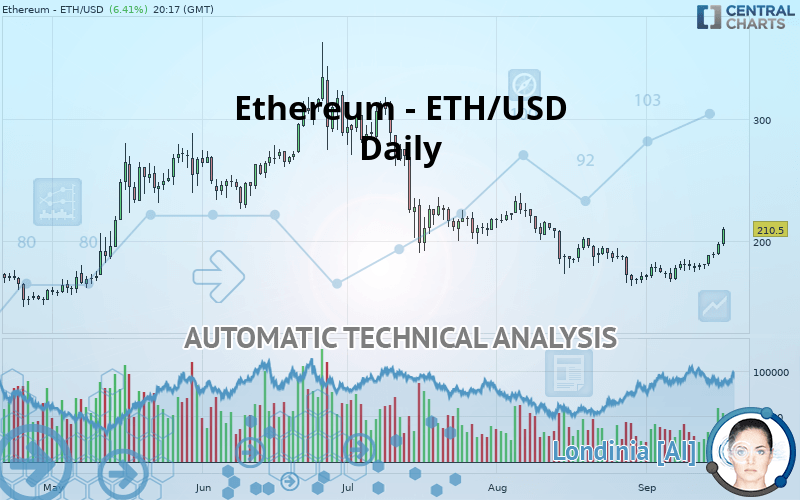
ETHEREUM - ETH/USD - Daily - Technical analysis published on 09/17/2019 (GMT)
- Who voted?
- 215
- 0
Click here for a new analysis!
- Timeframe : Daily
- - Analysis generated on
- Status : INVALID
Summary of the analysis

Additional analysis
Quotes
The Ethereum - ETH/USD rating is 210.50 USD. On the day, this instrument gained +6.41% with the lowest point at 196.10 USD and the highest point at 211.51 USD. The deviation from the price is +7.34% for the low point and -0.48% for the high point.A bearish opening was detected by the Central Gaps scanner. Sellers are trying to impose a bearish trend in the very short term.
Bearish opening
Type : Bearish
Timeframe : Openning
So that you have an overall view of the price change, here is a table showing the variations over several periods:
Technical
Technical analysis of Ethereum - ETH/USD in Daily shows an overall slightly bullish trend. Only 57.14% of the signals given by moving averages are bullish. This slightly bullish trend is reinforced by the strong signals currently being given by short-term moving averages. An assessment of moving averages reveals several bullish signals that could impact this trend:
Bullish trend reversal : adaptative moving average 50
Type : Bullish
Timeframe : Daily
Bullish price crossover with Moving Average 20
Type : Bullish
Timeframe : Daily
Bullish price crossover with Moving Average 50
Type : Bullish
Timeframe : Daily
Bullish price crossover with adaptative moving average 20
Type : Bullish
Timeframe : Daily
Bullish price crossover with adaptative moving average 50
Type : Bullish
Timeframe : Daily
An assessment of technical indicators shows a strong bullish signal.
Caution: the Central Indicators scanner currently detects an excess:
CCI indicator is overbought : over 100
Type : Neutral
Timeframe : Daily
Previous candle closed under Bollinger bands
Type : Neutral
Timeframe : Daily
RSI indicator: bullish divergence
Type : Bullish
Timeframe : Daily
Williams %R indicator is overbought : over -20
Type : Neutral
Timeframe : Daily
Pivot points : price is over resistance 2
Type : Neutral
Timeframe : Daily
Pivot points : price is over resistance 3
Type : Neutral
Timeframe : Weekly
RSI indicator is back over 50
Type : Bullish
Timeframe : Daily
Parabolic SAR indicator bullish reversal
Type : Bullish
Timeframe : Daily
Aroon indicator bullish trend
Type : Bullish
Timeframe : Daily
SuperTrend indicator bullish reversal
Type : Bullish
Timeframe : Daily
Momentum indicator is back over 0
Type : Bullish
Timeframe : Daily
Williams %R indicator is back over -50
Type : Bullish
Timeframe : Daily
Central Patterns, the market scanner focusing on chart patterns, resistances and supports found these results:
Near horizontal resistance
Type : Bearish
Timeframe : Daily
Resistance of channel is broken
Type : Bullish
Timeframe : Daily
The presence of a bullish Japanese candlestick pattern detected by Central Candlesticks that could cause a very short term rebound was also detected:
Abandoned baby morning star
Type : Bullish
Timeframe : Daily
| S3 | S2 | S1 | Price | R1 | R2 | R3 | |
|---|---|---|---|---|---|---|---|
| ProTrendLines | 132.38 | 152.13 | 191.31 | 210.50 | 232.25 | 271.04 | 334.17 |
| Change (%) | -37.11% | -27.73% | -9.12% | - | +10.33% | +28.76% | +58.75% |
| Change | -78.12 | -58.37 | -19.19 | - | +21.75 | +60.54 | +123.67 |
| Level | Minor | Minor | Major | - | Major | Minor | Intermediate |
Pivot points can also be used to set your price objectives. Here is the price situation in relation to pivot points:
| Pivot points | S3 | S2 | S1 | PP | R1 | R2 | R3 |
|---|---|---|---|---|---|---|---|
| Standard | 179.97 | 184.29 | 191.05 | 195.37 | 202.13 | 206.45 | 213.21 |
| Camarilla | 194.77 | 195.79 | 196.80 | 197.82 | 198.84 | 199.85 | 200.87 |
| Woodie | 181.20 | 184.90 | 192.28 | 195.98 | 203.36 | 207.06 | 214.44 |
| Fibonacci | 184.29 | 188.52 | 191.13 | 195.37 | 199.60 | 202.21 | 206.45 |
| Pivot points | S3 | S2 | S1 | PP | R1 | R2 | R3 |
|---|---|---|---|---|---|---|---|
| Standard | 164.57 | 169.63 | 179.14 | 184.20 | 193.71 | 198.77 | 208.28 |
| Camarilla | 184.64 | 185.98 | 187.31 | 188.65 | 189.99 | 191.32 | 192.66 |
| Woodie | 166.80 | 170.74 | 181.37 | 185.31 | 195.94 | 199.88 | 210.51 |
| Fibonacci | 169.63 | 175.20 | 178.63 | 184.20 | 189.77 | 193.20 | 198.77 |
| Pivot points | S3 | S2 | S1 | PP | R1 | R2 | R3 |
|---|---|---|---|---|---|---|---|
| Standard | 160.79 | 152.56 | 171.00 | 162.77 | 181.21 | 172.98 | 191.42 |
| Camarilla | 186.64 | 187.58 | 188.51 | 189.45 | 190.39 | 191.32 | 192.26 |
| Woodie | 174.14 | 159.23 | 184.35 | 169.44 | 194.56 | 179.65 | 204.77 |
| Fibonacci | 152.56 | 156.46 | 158.87 | 162.77 | 166.67 | 169.08 | 172.98 |
Numerical data
The following is the status of the technical indicators and moving averages at the time of publication of this technical analysis:
| RSI (14): | 60.03 | |
| MACD (12,26,9): | -0.3000 | |
| Directional Movement: | 9.33 | |
| AROON (14): | 14.29 | |
| DEMA (21): | 181.19 | |
| Parabolic SAR (0,02-0,02-0,2): | 144.32 | |
| Elder Ray (13): | 19.53 | |
| Super Trend (3,10): | 156.29 | |
| Zig ZAG (10): | 210.90 | |
| VORTEX (21): | 1.0700 | |
| Stochastique (14,3,5): | 67.16 | |
| TEMA (21): | 188.32 | |
| Williams %R (14): | -1.24 | |
| Chande Momentum Oscillator (20): | 41.31 | |
| Repulse (5,40,3): | 10.0100 | |
| ROCnROLL: | 1 | |
| TRIX (15,9): | -0.3000 | |
| Courbe Coppock: | 12.91 |
| MA7: | 185.05 | |
| MA20: | 179.14 | |
| MA50: | 192.88 | |
| MA100: | 228.35 | |
| MAexp7: | 187.83 | |
| MAexp20: | 183.87 | |
| MAexp50: | 194.34 | |
| MAexp100: | 205.69 | |
| Price / MA7: | +13.75% | |
| Price / MA20: | +17.51% | |
| Price / MA50: | +9.14% | |
| Price / MA100: | -7.82% | |
| Price / MAexp7: | +12.07% | |
| Price / MAexp20: | +14.48% | |
| Price / MAexp50: | +8.32% | |
| Price / MAexp100: | +2.34% |
About author

Online


Add a comment
Comments
0 comments on the analysis ETHEREUM - ETH/USD - Daily