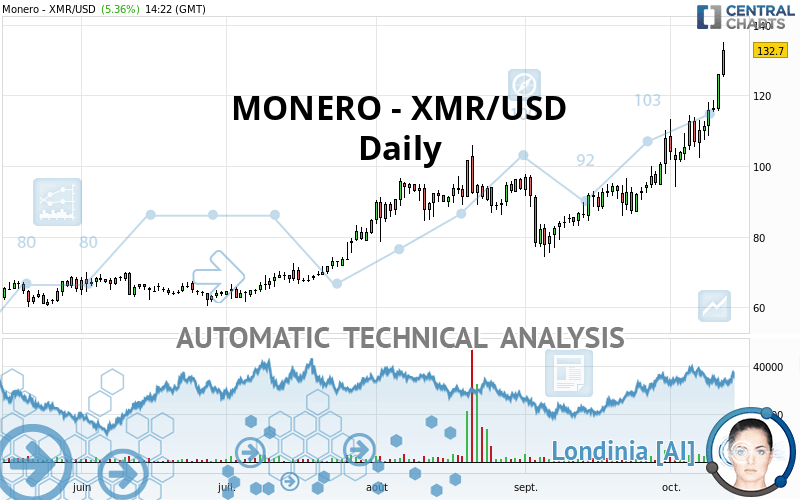
MONERO - XMR/USD - Daily - Technical analysis published on 10/12/2020 (GMT)
- Who voted?
- 160
- 0
Click here for a new analysis!
- Timeframe : Daily
- - Analysis generated on
- Status : LEVEL MAINTAINED

Summary of the analysis

Additional analysis
Quotes
The MONERO - XMR/USD rating is 132.70 USD. The price has increased by +5.36% since the last closing with the lowest point at 125.19 USD and the highest point at 135.09 USD. The deviation from the price is +6.00% for the low point and -1.77% for the high point.The Central Gaps scanner detects a bearish opening. A small advantage for sellers in the very short term.
Bearish opening
Type : Bearish
Timeframe : Openning
Here is a more detailed summary of the historical variations registered by MONERO - XMR/USD:
New HIGH record (1 year)
Type : Bullish
Timeframe : Weekly
New HIGH record (1st january)
Type : Bullish
Timeframe : Weekly
New HIGH record (1 month)
Type : Bullish
Timeframe : Weekly
Technical
Technical analysis of MONERO - XMR/USD in Daily shows a strongly overall bullish trend. The signals given by the moving averages are 92.86% bullish. This strong bullish trend is confirmed by the strong signals currently being given by short-term moving averages. The Central Indicators market scanner is currently detecting a bearish signal that could impact this trend:
Moving Average bearish crossovers : AMA50 & AMA100
Type : Bearish
Timeframe : Daily
In fact, 17 technical indicators on 18 studied are currently positioned bullish. Caution: the Central Indicators scanner currently detects an excess:
RSI indicator is overbought : over 70
Type : Neutral
Timeframe : Daily
CCI indicator is overbought : over 100
Type : Neutral
Timeframe : Daily
Williams %R indicator is overbought : over -20
Type : Neutral
Timeframe : Daily
Pivot points : price is over resistance 1
Type : Neutral
Timeframe : Daily
Pivot points : price is over resistance 2
Type : Neutral
Timeframe : Weekly
Central Patterns, the market scanner focusing on chart patterns, resistances and supports found this result:
Resistance of channel is broken
Type : Bullish
Timeframe : Daily
The Central Candlesticks scanner, specialised in Japanese candlesticks, did not identify any signals.
| S3 | S2 | S1 | Price | R1 | R2 | R3 | |
|---|---|---|---|---|---|---|---|
| ProTrendLines | 87.26 | 95.68 | 107.95 | 132.70 | 163.21 | 292.94 | 370.69 |
| Change (%) | -34.24% | -27.90% | -18.65% | - | +22.99% | +120.75% | +179.34% |
| Change | -45.44 | -37.02 | -24.75 | - | +30.51 | +160.24 | +237.99 |
| Level | Intermediate | Major | Major | - | Minor | Intermediate | Intermediate |
Attention could also be paid to pivot points to set price objectives:
| Pivot points | S3 | S2 | S1 | PP | R1 | R2 | R3 |
|---|---|---|---|---|---|---|---|
| Standard | 108.37 | 111.90 | 118.93 | 122.46 | 129.49 | 133.02 | 140.05 |
| Camarilla | 123.05 | 124.01 | 124.98 | 125.95 | 126.92 | 127.89 | 128.85 |
| Woodie | 110.11 | 112.78 | 120.67 | 123.34 | 131.23 | 133.90 | 141.79 |
| Fibonacci | 111.90 | 115.94 | 118.43 | 122.46 | 126.50 | 128.99 | 133.02 |
| Pivot points | S3 | S2 | S1 | PP | R1 | R2 | R3 |
|---|---|---|---|---|---|---|---|
| Standard | 88.07 | 94.81 | 105.29 | 112.03 | 122.51 | 129.25 | 139.73 |
| Camarilla | 111.04 | 112.62 | 114.20 | 115.78 | 117.36 | 118.94 | 120.52 |
| Woodie | 89.95 | 95.75 | 107.17 | 112.97 | 124.39 | 130.19 | 141.61 |
| Fibonacci | 94.81 | 101.39 | 105.45 | 112.03 | 118.61 | 122.67 | 129.25 |
| Pivot points | S3 | S2 | S1 | PP | R1 | R2 | R3 |
|---|---|---|---|---|---|---|---|
| Standard | 48.68 | 61.46 | 84.71 | 97.49 | 120.74 | 133.52 | 156.77 |
| Camarilla | 98.04 | 101.35 | 104.65 | 107.95 | 111.25 | 114.56 | 117.86 |
| Woodie | 53.91 | 64.08 | 89.94 | 100.11 | 125.97 | 136.14 | 162.00 |
| Fibonacci | 61.46 | 75.23 | 83.73 | 97.49 | 111.26 | 119.76 | 133.52 |
Numerical data
The following is the status of technical indicators and moving averages registered at the time this technical analysis was created:
| RSI (14): | 76.88 | |
| MACD (12,26,9): | 8.3700 | |
| Directional Movement: | 27.92 | |
| AROON (14): | 71.43 | |
| DEMA (21): | 118.64 | |
| Parabolic SAR (0,02-0,02-0,2): | 100.08 | |
| Elder Ray (13): | 16.80 | |
| Super Trend (3,10): | 106.74 | |
| Zig ZAG (10): | 132.88 | |
| VORTEX (21): | 1.2500 | |
| Stochastique (14,3,5): | 93.92 | |
| TEMA (21): | 123.58 | |
| Williams %R (14): | -6.16 | |
| Chande Momentum Oscillator (20): | 24.61 | |
| Repulse (5,40,3): | 15.1000 | |
| ROCnROLL: | 1 | |
| TRIX (15,9): | 0.8900 | |
| Courbe Coppock: | 45.24 |
| MA7: | 116.92 | |
| MA20: | 105.69 | |
| MA50: | 95.51 | |
| MA100: | 88.08 | |
| MAexp7: | 119.38 | |
| MAexp20: | 108.68 | |
| MAexp50: | 98.73 | |
| MAexp100: | 90.15 | |
| Price / MA7: | +13.50% | |
| Price / MA20: | +25.56% | |
| Price / MA50: | +38.94% | |
| Price / MA100: | +50.66% | |
| Price / MAexp7: | +11.16% | |
| Price / MAexp20: | +22.10% | |
| Price / MAexp50: | +34.41% | |
| Price / MAexp100: | +47.20% |
About author

Online


Add a comment
Comments
0 comments on the analysis MONERO - XMR/USD - Daily