DOGECOIN - DOGE/USDT - Daily - Technical analysis published on 08/27/2021 (GMT)
- 234
- 0
Click here for a new analysis!
- Timeframe : Daily
- - Analysis generated on
- Status : TARGET REACHED

Summary of the analysis

Additional analysis
Quotes
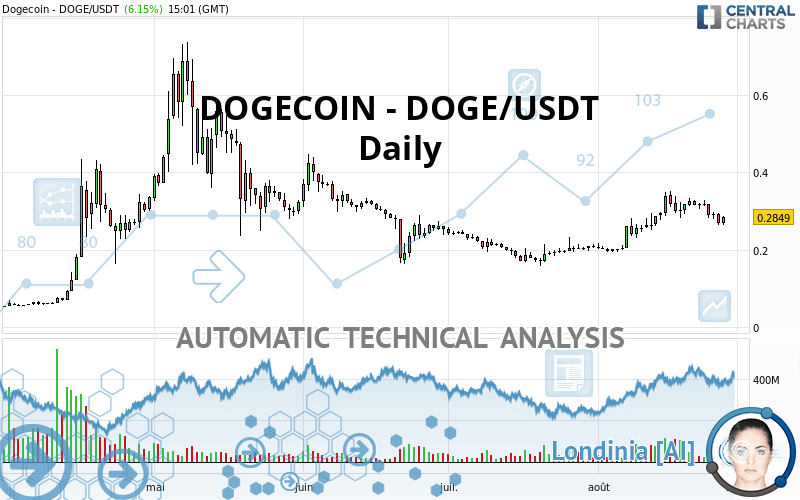
The DOGECOIN - DOGE/USDT rating is 0.284900 USDT. The price registered an increase of +6.15% on the session and was traded between 0.265200 USDT and 0.286400 USDT over the period. The price is currently at +7.43% from its lowest and -0.52% from its highest.The Central Gaps scanner detects a bullish opening marking the presence of buyers ahead of sellers at the opening but not sufficiently marked to allow the price to register a quotation gap.
Bullish opening
Type : Bullish
Timeframe : Openning
So that you have an overall view of the price change, here is a table showing the variations over several periods:
Technical
Technical analysis of DOGECOIN - DOGE/USDT in Daily shows an overall bullish trend. 67.86% of the signals given by moving averages are bullish. This bullish trend shows slight signs of slowing down given the slightly bullish signals given by the short-term moving averages. The Central Indicators market scanner is currently detecting several bearish signals that could impact this trend:
Bearish trend reversal : adaptative moving average 20
Type : Bearish
Timeframe : Daily
Bearish price crossover with Moving Average 20
Type : Bearish
Timeframe : Daily
Bearish price crossover with Moving Average 100
Type : Bearish
Timeframe : Daily
The probability of a further decline is low given the direction of the technical indicators.
But beware of excesses. The Central Indicators scanner currently detects this:
Williams %R indicator is oversold : under -80
Type : Neutral
Timeframe : Daily
Pivot points : price is under support 1
Type : Neutral
Timeframe : Weekly
RSI indicator is back under 50
Type : Bearish
Timeframe : Daily
Price is back over the pivot point
Type : Bullish
Timeframe : Weekly
Price is back under the pivot point
Type : Bearish
Timeframe : Daily
Momentum indicator is back under 0
Type : Bearish
Timeframe : Daily
An analysis of the price chart with the Central Patterns scanner (detector of chart patterns and resistances and supports) shows a result that can have an impact on the price change:
Support of channel is broken
Type : Bearish
Timeframe : Daily
The Central Candlesticks scanner, specialised in Japanese candlesticks, did not identify any signals.
| S3 | S2 | S1 | Price | R1 | R2 | R3 | |
|---|---|---|---|---|---|---|---|
| ProTrendLines | 0.078740 | 0.170400 | 0.263500 | 0.284900 | 0.339067 | 0.423100 | 0.559700 |
| Change (%) | -72.36% | -40.19% | -7.51% | - | +19.01% | +48.51% | +96.45% |
| Change | -0.206160 | -0.114500 | -0.021400 | - | +0.054167 | +0.138200 | +0.274800 |
| Level | Minor | Major | Intermediate | - | Intermediate | Minor | Minor |
Attention could also be paid to pivot points to set price objectives:
| Pivot points | S3 | S2 | S1 | PP | R1 | R2 | R3 |
|---|---|---|---|---|---|---|---|
| Standard | 0.225000 | 0.244800 | 0.256600 | 0.276400 | 0.288200 | 0.308000 | 0.319800 |
| Camarilla | 0.259710 | 0.262607 | 0.265503 | 0.268400 | 0.271297 | 0.274193 | 0.277090 |
| Woodie | 0.221000 | 0.242800 | 0.252600 | 0.274400 | 0.284200 | 0.306000 | 0.315800 |
| Fibonacci | 0.244800 | 0.256871 | 0.264329 | 0.276400 | 0.288471 | 0.295929 | 0.308000 |
| Pivot points | S3 | S2 | S1 | PP | R1 | R2 | R3 |
|---|---|---|---|---|---|---|---|
| Standard | 0.211467 | 0.246433 | 0.281567 | 0.316533 | 0.351667 | 0.386633 | 0.421767 |
| Camarilla | 0.297423 | 0.303848 | 0.310274 | 0.316700 | 0.323126 | 0.329552 | 0.335978 |
| Woodie | 0.211550 | 0.246475 | 0.281650 | 0.316575 | 0.351750 | 0.386675 | 0.421850 |
| Fibonacci | 0.246433 | 0.273212 | 0.289755 | 0.316533 | 0.343312 | 0.359855 | 0.386633 |
| Pivot points | S3 | S2 | S1 | PP | R1 | R2 | R3 |
|---|---|---|---|---|---|---|---|
| Standard | 0.093067 | 0.126133 | 0.166767 | 0.199833 | 0.240467 | 0.273533 | 0.314167 |
| Camarilla | 0.187133 | 0.193888 | 0.200644 | 0.207400 | 0.214156 | 0.220912 | 0.227668 |
| Woodie | 0.096850 | 0.128025 | 0.170550 | 0.201725 | 0.244250 | 0.275425 | 0.317950 |
| Fibonacci | 0.126133 | 0.154287 | 0.171680 | 0.199833 | 0.227987 | 0.245380 | 0.273533 |
Numerical data
The following are the details of the technical indicators and moving averages that were collected to generate this technical analysis:
| RSI (14): | 49.58 | |
| MACD (12,26,9): | 0.0145 | |
| Directional Movement: | 1.581059 | |
| AROON (14): | 21.428572 | |
| DEMA (21): | 0.305831 | |
| Parabolic SAR (0,02-0,02-0,2): | 0.335240 | |
| Elder Ray (13): | -0.017685 | |
| Super Trend (3,10): | 0.242667 | |
| Zig ZAG (10): | 0.274700 | |
| VORTEX (21): | 1.1012 | |
| Stochastique (14,3,5): | 20.09 | |
| TEMA (21): | 0.308293 | |
| Williams %R (14): | -88.03 | |
| Chande Momentum Oscillator (20): | -0.065200 | |
| Repulse (5,40,3): | -7.8970 | |
| ROCnROLL: | -1 | |
| TRIX (15,9): | 1.3464 | |
| Courbe Coppock: | 18.55 |
| MA7: | 0.296443 | |
| MA20: | 0.292205 | |
| MA50: | 0.236844 | |
| MA100: | 0.268172 | |
| MAexp7: | 0.290113 | |
| MAexp20: | 0.283715 | |
| MAexp50: | 0.263891 | |
| MAexp100: | 0.256162 | |
| Price / MA7: | -3.89% | |
| Price / MA20: | -2.50% | |
| Price / MA50: | +20.29% | |
| Price / MA100: | +6.24% | |
| Price / MAexp7: | -1.80% | |
| Price / MAexp20: | +0.42% | |
| Price / MAexp50: | +7.96% | |
| Price / MAexp100: | +11.22% |
About author

Online


Add a comment
Comments
0 comments on the analysis DOGECOIN - DOGE/USDT - Daily