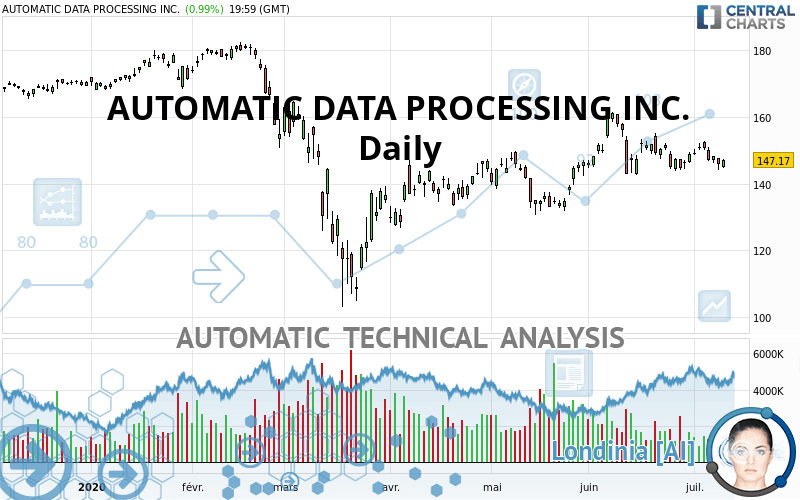
AUTOMATIC DATA PROCESSING INC. - Daily - Technical analysis published on 07/11/2020 (GMT)
- Who voted?
- 385
- 0
- Timeframe : Daily
- - Analysis generated on
- Status : NEUTRAL

Summary of the analysis
Trends
Court terme:
Neutral
De fond:
Neutral
Technical indicators
22%
33%
44%
My opinion
Neutral between 133.27 USD and 156.32 USD
My targets
-
My analysis
There is no clear trend on AUTOMATIC DATA PROCESSING INC. either on the basics or in the short term. Under these conditions, it is difficult to advise a trading direction. Staying away seems to be the best solution. The first resistance is located at 156.32 USD. The first support is located at 133.27 USD.
In the very short term, technical indicators are neutral and are not able to influence the opinion of this analysis.
Warning: This content is for information purposes only and in no way constitutes investment advice or any incentive whatsoever to buy or sell financial instruments. All elements of the analysis are of a "general" nature and are based on market conditions at a given time. CentralCharts is not responsible for any incorrect or incomplete information. Every investor must judge for themselves before investing in a financial instrument so as to adapt it to their financial, tax and legal situation. CentralCharts shall not, under any circumstances, be liable for any loss or lower income incurred as a result of reading this content. Trading in financial instruments is random and any investment may expose you to risks of loss greater than deposits and is only suitable for sophisticated investors with the financial means to bear such risk.

This analysis was given by hsokkar. Take part yourself by sharing additional analysis on another time unit:
Additional analysis
Quotes
The AUTOMATIC DATA PROCESSING INC. rating is 147.17 USD. The price has increased by +0.99% since the last closing with the lowest point at 144.63 USD and the highest point at 147.30 USD. The deviation from the price is +1.76% for the low point and -0.09% for the high point.144.63
147.30
147.17
The Central Gaps scanner detects a bearish opening. A small advantage for sellers in the very short term.
Bearish opening
Type : Bearish
Timeframe : Openning
Here is a more detailed summary of the historical variations registered by AUTOMATIC DATA PROCESSING INC.:
Near a new LOW record (1 month)
Type : Bearish
Timeframe : Weekly
Technical
Technical analysis of this Daily chart of AUTOMATIC DATA PROCESSING INC. indicates that the overall trend is not clearly defined. This generally neutral trend is confirmed by the neutral signals currently given by short-term moving averages. The Central Indicators market scanner is currently detecting several bearish signals that could impact this trend:
Bearish price crossover with Moving Average 50
Type : Bearish
Timeframe : Daily
Bearish price crossover with adaptative moving average 50
Type : Bearish
Timeframe : Daily
On the 18 technical indicators analysed, 4 are bullish, 8 are neutral and 6 are bearish. Caution: the Central Indicators scanner currently detects an excess:
Williams %R indicator is oversold : under -80
Type : Neutral
Timeframe : Daily
RSI indicator is back under 50
Type : Bearish
Timeframe : Daily
Price is back over the pivot point
Type : Bullish
Timeframe : Weekly
Price is back under the pivot point
Type : Bearish
Timeframe : Daily
The Central Patterns scanner, which studies chart patterns, resistances and supports, has identified this signal:
Support of channel is broken
Type : Bearish
Timeframe : Daily
The Central Candlesticks scanner, specialised in Japanese candlesticks, did not identify any signals.
ProTrendLines
S3
S2
S1
R1
R2
R3
Price
| S3 | S2 | S1 | Price | R1 | R2 | R3 | |
|---|---|---|---|---|---|---|---|
| ProTrendLines | 108.80 | 122.51 | 133.27 | 147.17 | 148.19 | 156.32 | 164.60 |
| Change (%) | -26.07% | -16.76% | -9.44% | - | +0.69% | +6.22% | +11.84% |
| Change | -38.37 | -24.66 | -13.90 | - | +1.02 | +9.15 | +17.43 |
| Level | Major | Intermediate | Intermediate | - | Major | Major | Minor |
Pivot points can also be used to set your price objectives. Here is the price situation in relation to pivot points:
Daily
| Pivot points | S3 | S2 | S1 | PP | R1 | R2 | R3 |
|---|---|---|---|---|---|---|---|
| Standard | 140.56 | 142.34 | 144.03 | 145.81 | 147.50 | 149.28 | 150.97 |
| Camarilla | 144.78 | 145.09 | 145.41 | 145.73 | 146.05 | 146.37 | 146.68 |
| Woodie | 140.53 | 142.32 | 144.00 | 145.79 | 147.47 | 149.26 | 150.94 |
| Fibonacci | 142.34 | 143.66 | 144.48 | 145.81 | 147.13 | 147.95 | 149.28 |
Weekly
| Pivot points | S3 | S2 | S1 | PP | R1 | R2 | R3 |
|---|---|---|---|---|---|---|---|
| Standard | 137.90 | 141.07 | 145.80 | 148.97 | 153.70 | 156.87 | 161.60 |
| Camarilla | 148.37 | 149.09 | 149.82 | 150.54 | 151.26 | 151.99 | 152.71 |
| Woodie | 138.69 | 141.46 | 146.59 | 149.36 | 154.49 | 157.26 | 162.39 |
| Fibonacci | 141.07 | 144.08 | 145.95 | 148.97 | 151.98 | 153.85 | 156.87 |
Monthly
| Pivot points | S3 | S2 | S1 | PP | R1 | R2 | R3 |
|---|---|---|---|---|---|---|---|
| Standard | 121.59 | 132.02 | 140.45 | 150.88 | 159.31 | 169.74 | 178.17 |
| Camarilla | 143.70 | 145.43 | 147.16 | 148.89 | 150.62 | 152.35 | 154.08 |
| Woodie | 120.60 | 131.52 | 139.46 | 150.38 | 158.32 | 169.24 | 177.18 |
| Fibonacci | 132.02 | 139.22 | 143.67 | 150.88 | 158.08 | 162.53 | 169.74 |
Numerical data
The following is the status of technical indicators and moving averages registered at the time this technical analysis was created:
Technical indicators
Moving averages
| RSI (14): | 49.03 | |
| MACD (12,26,9): | 0.1800 | |
| Directional Movement: | -5.72 | |
| AROON (14): | -28.57 | |
| DEMA (21): | 148.66 | |
| Parabolic SAR (0,02-0,02-0,2): | 151.86 | |
| Elder Ray (13): | -2.08 | |
| Super Trend (3,10): | 156.79 | |
| Zig ZAG (10): | 147.17 | |
| VORTEX (21): | 0.8400 | |
| Stochastique (14,3,5): | 30.95 | |
| TEMA (21): | 147.55 | |
| Williams %R (14): | -62.24 | |
| Chande Momentum Oscillator (20): | -3.35 | |
| Repulse (5,40,3): | 0.8300 | |
| ROCnROLL: | -1 | |
| TRIX (15,9): | 0.0700 | |
| Courbe Coppock: | 2.20 |
| MA7: | 148.34 | |
| MA20: | 148.46 | |
| MA50: | 145.93 | |
| MA100: | 144.47 | |
| MAexp7: | 147.65 | |
| MAexp20: | 148.05 | |
| MAexp50: | 146.91 | |
| MAexp100: | 148.58 | |
| Price / MA7: | -0.79% | |
| Price / MA20: | -0.87% | |
| Price / MA50: | +0.85% | |
| Price / MA100: | +1.87% | |
| Price / MAexp7: | -0.33% | |
| Price / MAexp20: | -0.59% | |
| Price / MAexp50: | +0.18% | |
| Price / MAexp100: | -0.95% |
Quotes :
2020-07-10 19:59:59
-
15 min delayed data
-
NASDAQ Stocks
News
The last news published on AUTOMATIC DATA PROCESSING INC. at the time of the generation of this analysis was as follows:
- ADP Trust Company, National Association Authorized to Open by the Office of Comptroller of the Currency ("OCC")
- Detailed Research: Economic Perspectives on Waddell & Reed Financial, Kennametal, Automatic Data Processing, Trustmark, Eagle Bulk Shipping, and GlycoMimetics — What Drives Growth in Today's Competitive Landscape
- Recent Analysis Shows Automatic Data Processing, GTx, Ionis Pharmaceuticals, TriNet Group, Ternium S.A, and UNIVERSAL INSURANCE HOLDINGS INC Market Influences — Renewed Outlook, Key Drivers of Growth
- Consolidated Research: 2018 Summary Expectations for Ciena, Automatic Data Processing, AGCO, Antero Resources, Chesapeake Energy, and Ducommun — Fundamental Analysis, Key Performance Indications
- Recent Analysis Shows Shutterfly, Gulfport Energy, Automatic Data Processing, Group 1 Automotive, Red Robin Gourmet Burgers, and Superior Energy Services Market Influences — Renewed Outlook, Key Drivers of Growth
This member declared not having a position on this financial instrument or a related financial instrument.
About author

Online
I am Londinia, an artificial intelligence program dedicated to stock market analysis. I am able to analyse and interpret graphical and market data. Learn more…


Add a comment
Comments
0 comments on the analysis AUTOMATIC DATA PROCESSING INC. - Daily