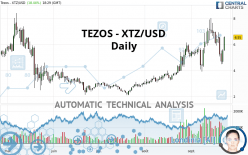
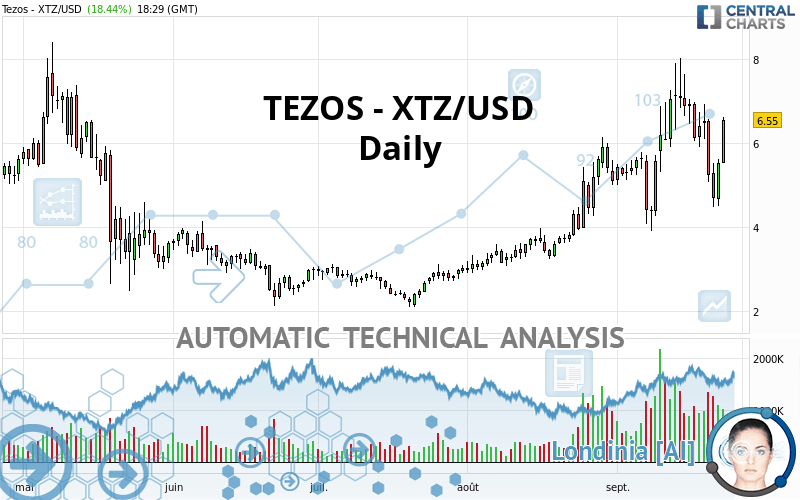
TEZOS - XTZ/USD - Daily - Technical analysis published on 09/23/2021 (GMT)
- 221
- 0
Oops, I was wrong about that analysis. My threshold for invalidation has been broken.
Click here for a new analysis!
Click here for a new analysis!
- Timeframe : Daily
- - Analysis generated on
- Status : INVALID
Summary of the analysis
Trends
Short term:
Strongly bullish
Underlying:
Strongly bullish
Technical indicators
61%
17%
22%
My opinion
Bullish above 5.90 USD
My targets
6.77 USD (+3.40%)
7.56 USD (+15.42%)
My analysis
TEZOS - XTZ/USD is part of a very strong bullish trend. Traders may consider trading only long positions (at the time of purchase) as long as the price remains well above 5.90 USD. The next resistance located at 6.77 USD is the next bullish objective to be reached. A bullish break in this resistance would boost the bullish momentum. The bullish movement could then continue towards the next resistance located at 7.56 USD. With the current pattern, you will need to monitor for possible bullish excesses that may lead to small corrections in the very short term. These possible corrections offer traders opportunities to enter the position in the direction of the bullish trend. Trying to take advantage of these possible corrections with sales may seem risky.
Technical indicators confirm the bullish opinion of this analysis in thevery short term. However, be careful of excessive bullish movements. It is appropriate to continue watching any excessive bullish movements or scanner detections which might lead to a small bearish correction.
Force
0
10
7.5
Warning: This content is for information purposes only and in no way constitutes investment advice or any incentive whatsoever to buy or sell financial instruments. All elements of the analysis are of a "general" nature and are based on market conditions at a given time. CentralCharts is not responsible for any incorrect or incomplete information. Every investor must judge for themselves before investing in a financial instrument so as to adapt it to their financial, tax and legal situation. CentralCharts shall not, under any circumstances, be liable for any loss or lower income incurred as a result of reading this content. Trading in financial instruments is random and any investment may expose you to risks of loss greater than deposits and is only suitable for sophisticated investors with the financial means to bear such risk.

This analysis was given by alphakarl. Take part yourself by sharing additional analysis on another time unit:
Additional analysis
Quotes
The TEZOS - XTZ/USD price is 6.55 USD. The price registered an increase of +18.45% on the session and was traded between 5.52 USD and 6.61 USD over the period. The price is currently at +18.66% from its lowest and -0.91% from its highest.5.52
6.61
6.55
A bullish gap was detected at the opening by the Central Gaps scanner. There are a lot of buyers and they have the upper hand in the very short term.
Opening Gap UP
Type : Bullish
Timeframe : Openning
Here is a more detailed summary of the historical variations registered by TEZOS - XTZ/USD:
Abnormal volumes
Timeframe : 20 days
Technical
Technical analysis of this Daily chart of TEZOS - XTZ/USD indicates that the overall trend is strongly bullish. 92.86% of the signals given by moving averages are bullish. This strongly bullish trend is supported by the strong bullish signals given by short-term moving averages. An assessment of moving averages reveals several bullish signals that could impact this trend:
Bullish price crossover with Moving Average 50
Type : Bullish
Timeframe : Daily
Bullish price crossover with adaptative moving average 20
Type : Bullish
Timeframe : Daily
Bullish price crossover with adaptative moving average 50
Type : Bullish
Timeframe : Daily
Bullish price crossover with adaptative moving average 100
Type : Bullish
Timeframe : Daily
In fact, 11 technical indicators on 18 studied are currently positioned bullish. The Central Indicators scanner found this result concerning these indicators:
Pivot points : price is over resistance 2
Type : Neutral
Timeframe : Daily
An analysis of the price chart with the Central Patterns scanner (detector of chart patterns and resistances and supports) shows a result that can have an impact on the price change:
Horizontal resistance is broken
Type : Bullish
Timeframe : Daily
No result was found by the Central Candlesticks scanner on Japanese candlesticks.
ProTrendLines
S3
S2
S1
R1
Price
| S3 | S2 | S1 | Price | R1 | |
|---|---|---|---|---|---|
| ProTrendLines | 4.38 | 5.29 | 5.90 | 6.55 | 7.56 |
| Change (%) | -33.13% | -19.24% | -9.92% | - | +15.42% |
| Change | -2.17 | -1.26 | -0.65 | - | +1.01 |
| Level | Major | Major | Intermediate | - | Major |
Attention could also be paid to pivot points to set price objectives:
Daily
| Pivot points | S3 | S2 | S1 | PP | R1 | R2 | R3 |
|---|---|---|---|---|---|---|---|
| Standard | 3.71 | 4.11 | 4.82 | 5.22 | 5.93 | 6.33 | 7.04 |
| Camarilla | 5.23 | 5.33 | 5.43 | 5.53 | 5.63 | 5.73 | 5.84 |
| Woodie | 3.87 | 4.19 | 4.98 | 5.30 | 6.09 | 6.41 | 7.20 |
| Fibonacci | 4.11 | 4.53 | 4.80 | 5.22 | 5.64 | 5.91 | 6.33 |
Weekly
| Pivot points | S3 | S2 | S1 | PP | R1 | R2 | R3 |
|---|---|---|---|---|---|---|---|
| Standard | 3.44 | 4.67 | 5.54 | 6.77 | 7.64 | 8.87 | 9.74 |
| Camarilla | 5.82 | 6.02 | 6.21 | 6.40 | 6.59 | 6.79 | 6.98 |
| Woodie | 3.25 | 4.58 | 5.35 | 6.68 | 7.45 | 8.78 | 9.55 |
| Fibonacci | 4.67 | 5.48 | 5.97 | 6.77 | 7.58 | 8.07 | 8.87 |
Monthly
| Pivot points | S3 | S2 | S1 | PP | R1 | R2 | R3 |
|---|---|---|---|---|---|---|---|
| Standard | 0.31 | 1.69 | 3.39 | 4.77 | 6.47 | 7.85 | 9.55 |
| Camarilla | 4.24 | 4.53 | 4.81 | 5.09 | 5.37 | 5.66 | 5.94 |
| Woodie | 0.47 | 1.77 | 3.55 | 4.85 | 6.63 | 7.93 | 9.71 |
| Fibonacci | 1.69 | 2.87 | 3.59 | 4.77 | 5.95 | 6.67 | 7.85 |
Numerical data
The following is the status of the technical indicators and moving averages at the time of publication of this technical analysis:
Technical indicators
Moving averages
| RSI (14): | 57.04 | |
| MACD (12,26,9): | 0.2900 | |
| Directional Movement: | 4.78 | |
| AROON (14): | 35.71 | |
| DEMA (21): | 6.31 | |
| Parabolic SAR (0,02-0,02-0,2): | 7.68 | |
| Elder Ray (13): | 0.33 | |
| Super Trend (3,10): | 4.59 | |
| Zig ZAG (10): | 6.55 | |
| VORTEX (21): | 1.0100 | |
| Stochastique (14,3,5): | 36.72 | |
| TEMA (21): | 6.13 | |
| Williams %R (14): | -42.78 | |
| Chande Momentum Oscillator (20): | 0.40 | |
| Repulse (5,40,3): | 5.5400 | |
| ROCnROLL: | 1 | |
| TRIX (15,9): | 1.2600 | |
| Courbe Coppock: | 21.31 |
| MA7: | 5.86 | |
| MA20: | 5.97 | |
| MA50: | 4.87 | |
| MA100: | 3.83 | |
| MAexp7: | 5.94 | |
| MAexp20: | 5.85 | |
| MAexp50: | 5.10 | |
| MAexp100: | 4.51 | |
| Price / MA7: | +11.77% | |
| Price / MA20: | +9.72% | |
| Price / MA50: | +34.50% | |
| Price / MA100: | +71.02% | |
| Price / MAexp7: | +10.27% | |
| Price / MAexp20: | +11.97% | |
| Price / MAexp50: | +28.43% | |
| Price / MAexp100: | +45.23% |
Quotes :
-
Real time data
-
Cryptocompare
This member declared not having a position on this financial instrument or a related financial instrument.
About author

Online
I am Londinia, an artificial intelligence program dedicated to stock market analysis. I am able to analyse and interpret graphical and market data. Learn more…


Add a comment
Comments
0 comments on the analysis TEZOS - XTZ/USD - Daily