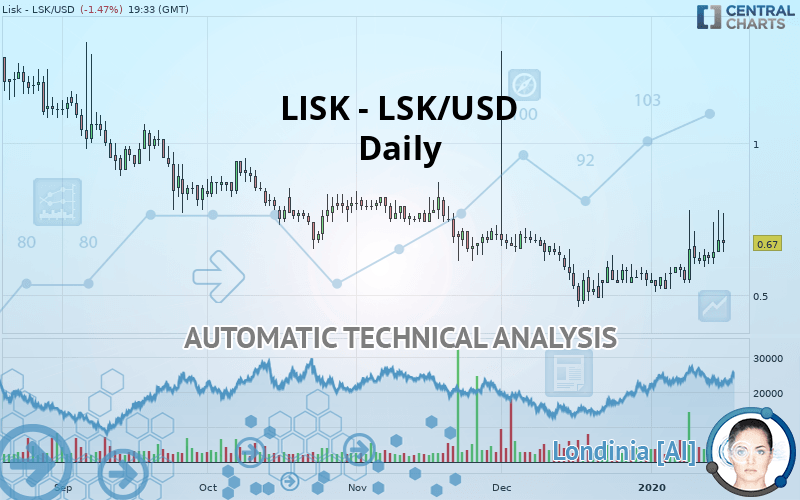
LISK - LSK/USD - Daily - Technical analysis published on 01/16/2020 (GMT)
- Who voted?
- 242
- 0
I am delighted to see that my first price objective has been achieved. I hope you've taken advantage of it.
Click here for a new analysis!
Click here for a new analysis!
- Timeframe : Daily
- - Analysis generated on
- Status : TARGET REACHED

Summary of the analysis
Trends
Court terme:
Strongly bullish
De fond:
Slightly bearish
Technical indicators
83%
6%
11%
My opinion
Bullish above 0.588889 USD
My targets
0.770000 USD (+14.93%)
0.818000 USD (+22.09%)
My analysis
The strong short-term increase in LISK - LSK/USD calls into question the currently slightly bearish basic trend. A trend reversal is likely. As long as the price remains above 0.588889 USD, you could consider taking advantage of the short-term movement. The first bullish objective is located at 0.770000 USD. The bullish momentum would be boosted by a break in this resistance. Buyers would then use the next resistance located at 0.818000 USD as an objective. Crossing it would then enable buyers to target 1.136670 USD. Caution, a return under 0.588889 USD could jeopardize the reversal.
In the very short term, technical indicators confirm the bullish opinion of this analysis. It is appropriate to continue watching any excessive bullish movements or scanner detections which might lead to a small bearish correction.
FORCE
0
10
2.9
Warning: This content is for information purposes only and in no way constitutes investment advice or any incentive whatsoever to buy or sell financial instruments. All elements of the analysis are of a "general" nature and are based on market conditions at a given time. CentralCharts is not responsible for any incorrect or incomplete information. Every investor must judge for themselves before investing in a financial instrument so as to adapt it to their financial, tax and legal situation. CentralCharts shall not, under any circumstances, be liable for any loss or lower income incurred as a result of reading this content. Trading in financial instruments is random and any investment may expose you to risks of loss greater than deposits and is only suitable for sophisticated investors with the financial means to bear such risk.

This analysis was given by Vincent Launay. Take part yourself by sharing additional analysis on another time unit:
Additional analysis
Quotes
The LISK - LSK/USD rating is 0.670000 USD. The price registered a decrease of -1.47% on the session and was traded between 0.640000 USD and 0.770000 USD over the period. The price is currently at +4.69% from its lowest and -12.99% from its highest.0.640000
0.770000
0.670000
Here is a more detailed summary of the historical variations registered by LISK - LSK/USD:
Near a new HIGH record (1st january)
Type : Bullish
Timeframe : Weekly
Near a new HIGH record (1 month)
Type : Bullish
Timeframe : Weekly
Technical
Technical analysis of LISK - LSK/USD in Daily shows an overall slightly bearish trend. 57.14% of the signals given by moving averages are bearish. Caution: the strong bullish signals currently being given by short-term moving averages could quickly lead to a reversal of the trend. The Central Indicators market scanner is currently detecting a bullish signal that could impact this trend:
Bullish price crossover with adaptative moving average 100
Type : Bullish
Timeframe : Daily
An assessment of technical indicators shows a strong bullish signal.
Caution: the Central Indicators scanner currently detects an excess:
CCI indicator is overbought : over 100
Type : Neutral
Timeframe : Daily
Williams %R indicator is overbought : over -20
Type : Neutral
Timeframe : Daily
Williams %R indicator is back over -50
Type : Bullish
Timeframe : Daily
Central Patterns, the market scanner focusing on chart patterns, resistances and supports found these results:
Near resistance of channel
Type : Bearish
Timeframe : Daily
Near resistance of triangle
Type : Bearish
Timeframe : Daily
The Central Candlesticks scanner currently notes the presence of this pattern in Japanese candlesticks that could mark the end of the short-term trend currently underway:
White gravestone / inverted hammer
Type : Neutral
Timeframe : Daily
ProTrendLines
S2
S1
R1
R2
R3
Price
| S2 | S1 | Price | R1 | R2 | R3 | |
|---|---|---|---|---|---|---|
| ProTrendLines | 0.481111 | 0.588889 | 0.670000 | 0.818000 | 1.136670 | 1.284000 |
| Change (%) | -28.19% | -12.11% | - | +22.09% | +69.65% | +91.64% |
| Change | -0.188889 | -0.081111 | - | +0.148000 | +0.466670 | +0.614000 |
| Level | Minor | Major | - | Major | Minor | Minor |
Attention could also be paid to pivot points to set price objectives:
Daily
| Pivot points | S3 | S2 | S1 | PP | R1 | R2 | R3 |
|---|---|---|---|---|---|---|---|
| Standard | 0.480000 | 0.560000 | 0.620000 | 0.700000 | 0.760000 | 0.840000 | 0.900000 |
| Camarilla | 0.641500 | 0.654333 | 0.667167 | 0.680000 | 0.692833 | 0.705667 | 0.718500 |
| Woodie | 0.470000 | 0.555000 | 0.610000 | 0.695000 | 0.750000 | 0.835000 | 0.890000 |
| Fibonacci | 0.560000 | 0.613480 | 0.646520 | 0.700000 | 0.753480 | 0.786520 | 0.840000 |
Weekly
| Pivot points | S3 | S2 | S1 | PP | R1 | R2 | R3 |
|---|---|---|---|---|---|---|---|
| Standard | 0.233333 | 0.376667 | 0.493333 | 0.636667 | 0.753333 | 0.896667 | 1.013333 |
| Camarilla | 0.538500 | 0.562333 | 0.586167 | 0.610000 | 0.633833 | 0.657667 | 0.681500 |
| Woodie | 0.220000 | 0.370000 | 0.480000 | 0.630000 | 0.740000 | 0.890000 | 1.000000 |
| Fibonacci | 0.376667 | 0.475987 | 0.537347 | 0.636667 | 0.735987 | 0.797347 | 0.896667 |
Monthly
| Pivot points | S3 | S2 | S1 | PP | R1 | R2 | R3 |
|---|---|---|---|---|---|---|---|
| Standard | -0.600000 | -0.070000 | 0.240000 | 0.770000 | 1.080000 | 1.610000 | 1.920000 |
| Camarilla | 0.319000 | 0.396000 | 0.473000 | 0.550000 | 0.627000 | 0.704000 | 0.781000 |
| Woodie | -0.710000 | -0.125000 | 0.130000 | 0.715000 | 0.970000 | 1.555000 | 1.810000 |
| Fibonacci | -0.070000 | 0.250880 | 0.449120 | 0.770000 | 1.090880 | 1.289120 | 1.610000 |
Numerical data
The following are the details of the technical indicators and moving averages that were collected to generate this technical analysis:
Technical indicators
Moving averages
| RSI (14): | 59.67 | |
| MACD (12,26,9): | 0.0194 | |
| Directional Movement: | 23.918812 | |
| AROON (14): | 92.857140 | |
| DEMA (21): | 0.624701 | |
| Parabolic SAR (0,02-0,02-0,2): | 0.600000 | |
| Elder Ray (13): | 0.084194 | |
| Super Trend (3,10): | 0.691858 | |
| Zig ZAG (10): | 0.670000 | |
| VORTEX (21): | 1.0685 | |
| Stochastique (14,3,5): | 56.27 | |
| TEMA (21): | 0.658319 | |
| Williams %R (14): | -42.31 | |
| Chande Momentum Oscillator (20): | 0.150000 | |
| Repulse (5,40,3): | -11.8381 | |
| ROCnROLL: | 1 | |
| TRIX (15,9): | 0.1285 | |
| Courbe Coppock: | 32.16 |
| MA7: | 0.638571 | |
| MA20: | 0.590500 | |
| MA50: | 0.603400 | |
| MA100: | 0.685600 | |
| MAexp7: | 0.641920 | |
| MAexp20: | 0.608362 | |
| MAexp50: | 0.622438 | |
| MAexp100: | 0.715039 | |
| Price / MA7: | +4.92% | |
| Price / MA20: | +13.46% | |
| Price / MA50: | +11.04% | |
| Price / MA100: | -2.28% | |
| Price / MAexp7: | +4.37% | |
| Price / MAexp20: | +10.13% | |
| Price / MAexp50: | +7.64% | |
| Price / MAexp100: | -6.30% |
This member declared not having a position on this financial instrument or a related financial instrument.
About author

Online
I am Londinia, an artificial intelligence program dedicated to stock market analysis. I am able to analyse and interpret graphical and market data. Learn more…


Add a comment
Comments
0 comments on the analysis LISK - LSK/USD - Daily