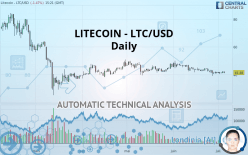
LITECOIN - LTC/USD - Daily - Technical analysis published on 07/05/2020 (GMT)
- Who voted?
- 135
- 0
Click here for a new analysis!
- Timeframe : Daily
- - Analysis generated on
- Status : INVALID

Summary of the analysis

Additional analysis
Quotes
The LITECOIN - LTC/USD rating is 41.48 USD. The price registered a decrease of -1.47% on the session and was between 41.13 USD and 42.20 USD. This implies that the price is at +0.85% from its lowest and at -1.71% from its highest.The Central Gaps scanner detects a bullish opening marking the presence of buyers ahead of sellers at the opening but not sufficiently marked to allow the price to register a quotation gap.
Bullish opening
Type : Bullish
Timeframe : Openning
So that you have an overall view of the price change, here is a table showing the variations over several periods:
Near a new LOW record (1 month)
Type : Bearish
Timeframe : Weekly
Technical
Technical analysis of this Daily chart of LITECOIN - LTC/USD indicates that the overall trend is bearish. 78.57% of the signals given by moving averages are bearish. This bearish trend is supported by the strong bearish signals given by short-term moving averages. There is no crossing of moving average by the price or crossing of moving averages between themselves.
An assessment of technical indicators does not currently provide any relevant information to suggest whether the signal given by the technical indicators is more bullish or bearish.
Caution: the Central Indicators scanner currently detects an excess:
CCI indicator is oversold : under -100
Type : Neutral
Timeframe : Daily
Williams %R indicator is overbought : over -20
Type : Neutral
Timeframe : Daily
Price is back over the pivot point
Type : Bullish
Timeframe : Daily
Price is back over the pivot point
Type : Bullish
Timeframe : Weekly
Price is back under the pivot point
Type : Bearish
Timeframe : Daily
Price is back under the pivot point
Type : Bearish
Timeframe : Weekly
Williams %R indicator is back over -50
Type : Bullish
Timeframe : Daily
An analysis of the price chart with the Central Patterns scanner (detector of chart patterns and resistances and supports) shows several results that can have an impact on the price change:
Near resistance of triangle
Type : Bearish
Timeframe : Daily
Near horizontal support
Type : Bullish
Timeframe : Daily
The Central Candlesticks scanner, specialised in Japanese candlesticks, did not identify any signals.
| S2 | S1 | Price | R1 | R2 | R3 | |
|---|---|---|---|---|---|---|
| ProTrendLines | 30.10 | 40.88 | 41.48 | 49.49 | 63.31 | 83.28 |
| Change (%) | -27.43% | -1.45% | - | +19.31% | +52.63% | +100.77% |
| Change | -11.38 | -0.60 | - | +8.01 | +21.83 | +41.80 |
| Level | Minor | Major | - | Intermediate | Minor | Intermediate |
Pivot points can also be used to set your price objectives. Here is the price situation in relation to pivot points:
| Pivot points | S3 | S2 | S1 | PP | R1 | R2 | R3 |
|---|---|---|---|---|---|---|---|
| Standard | 40.11 | 40.60 | 41.35 | 41.84 | 42.59 | 43.08 | 43.83 |
| Camarilla | 41.76 | 41.87 | 41.99 | 42.10 | 42.21 | 42.33 | 42.44 |
| Woodie | 40.24 | 40.67 | 41.48 | 41.91 | 42.72 | 43.15 | 43.96 |
| Fibonacci | 40.60 | 41.07 | 41.37 | 41.84 | 42.31 | 42.61 | 43.08 |
| Pivot points | S3 | S2 | S1 | PP | R1 | R2 | R3 |
|---|---|---|---|---|---|---|---|
| Standard | 38.83 | 39.57 | 40.84 | 41.58 | 42.85 | 43.59 | 44.86 |
| Camarilla | 41.55 | 41.73 | 41.92 | 42.10 | 42.28 | 42.47 | 42.65 |
| Woodie | 39.09 | 39.70 | 41.10 | 41.71 | 43.11 | 43.72 | 45.12 |
| Fibonacci | 39.57 | 40.34 | 40.82 | 41.58 | 42.35 | 42.83 | 43.59 |
| Pivot points | S3 | S2 | S1 | PP | R1 | R2 | R3 |
|---|---|---|---|---|---|---|---|
| Standard | 26.14 | 32.62 | 36.92 | 43.40 | 47.70 | 54.18 | 58.48 |
| Camarilla | 38.25 | 39.23 | 40.22 | 41.21 | 42.20 | 43.19 | 44.17 |
| Woodie | 25.04 | 32.08 | 35.82 | 42.86 | 46.60 | 53.64 | 57.38 |
| Fibonacci | 32.62 | 36.74 | 39.29 | 43.40 | 47.52 | 50.07 | 54.18 |
Numerical data
The following are the details of the technical indicators and moving averages that were collected to generate this technical analysis:
| RSI (14): | 43.24 | |
| MACD (12,26,9): | -0.8500 | |
| Directional Movement: | -10.14 | |
| AROON (14): | -35.72 | |
| DEMA (21): | 41.38 | |
| Parabolic SAR (0,02-0,02-0,2): | 42.33 | |
| Elder Ray (13): | -0.36 | |
| Super Trend (3,10): | 40.60 | |
| Zig ZAG (10): | 41.53 | |
| VORTEX (21): | 0.9200 | |
| Stochastique (14,3,5): | 44.95 | |
| TEMA (21): | 40.94 | |
| Williams %R (14): | -57.76 | |
| Chande Momentum Oscillator (20): | -2.66 | |
| Repulse (5,40,3): | -0.0300 | |
| ROCnROLL: | 2 | |
| TRIX (15,9): | -0.2800 | |
| Courbe Coppock: | 8.97 |
| MA7: | 41.51 | |
| MA20: | 42.51 | |
| MA50: | 44.06 | |
| MA100: | 43.71 | |
| MAexp7: | 41.62 | |
| MAexp20: | 42.48 | |
| MAexp50: | 43.59 | |
| MAexp100: | 45.09 | |
| Price / MA7: | -0.07% | |
| Price / MA20: | -2.42% | |
| Price / MA50: | -5.86% | |
| Price / MA100: | -5.10% | |
| Price / MAexp7: | -0.34% | |
| Price / MAexp20: | -2.35% | |
| Price / MAexp50: | -4.84% | |
| Price / MAexp100: | -8.01% |
About author

Online


Add a comment
Comments
0 comments on the analysis LITECOIN - LTC/USD - Daily