LITECOIN - LTC/USD - Daily - Technical analysis published on 07/10/2020 (GMT)
- Who voted?
- 100
- 0
- Timeframe : Daily
- - Analysis generated on
- Status : NEUTRAL
Summary of the analysis

Additional analysis
Quotes
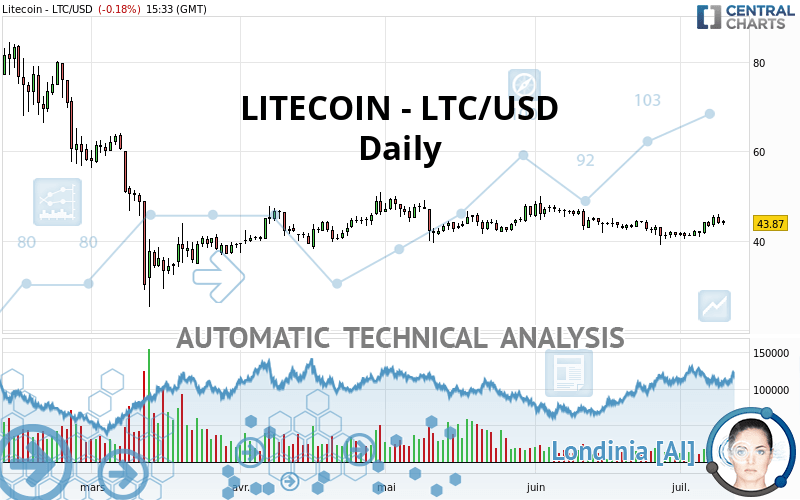
The LITECOIN - LTC/USD price is 43.87 USD. The price is lower by -0.18% since the last closing with the lowest point at 43.53 USD and the highest point at 44.58 USD. The deviation from the price is +0.78% for the low point and -1.59% for the high point.A bullish opening was detected by the Central Gaps scanner. Buyers are trying to impose a bullish momentum in the very short term.
Bullish opening
Type : Bullish
Timeframe : Openning
A study of price movements over other periods shows the following variations:
Near a new LOW record (1 month)
Type : Bearish
Timeframe : Weekly
Technical
Technical analysis of LITECOIN - LTC/USD in Daily shows an overall slightly bearish trend. Only 50.00% of the signals given by moving averages are bearish. This slightly bearish trend could return to neutral given the neutral signals also given by short-term moving averages. The Central Indicators market scanner is currently detecting several bearish signals that could impact this trend:
Bearish trend reversal : adaptative moving average 50
Type : Bearish
Timeframe : Daily
Bearish price crossover with Moving Average 50
Type : Bearish
Timeframe : Daily
Bearish price crossover with Moving Average 100
Type : Bearish
Timeframe : Daily
Bearish price crossover with adaptative moving average 20
Type : Bearish
Timeframe : Daily
The technical indicators are generally neutral. They do not provide relevant information on the direction of future price movements.
Caution: the Central Indicators scanner currently detects an excess:
Williams %R indicator is oversold : under -80
Type : Neutral
Timeframe : Daily
Williams %R indicator is overbought : over -20
Type : Neutral
Timeframe : Daily
Pivot points : price is over resistance 3
Type : Neutral
Timeframe : Weekly
RSI indicator is back under 50
Type : Bearish
Timeframe : Daily
Ichimoku : price is under the cloud
Type : Bearish
Timeframe : Daily
Price is back under the pivot point
Type : Bearish
Timeframe : Daily
Price is back under the pivot point
Type : Bearish
Timeframe : Weekly
The Central Patterns scanner, which studies chart patterns, resistances and supports, has identified this signal:
Near resistance of channel
Type : Bearish
Timeframe : Daily
For a small setback in the very short term, the Central Candlesticks scanner currently notes the presence of this bearish pattern in Japanese candlesticks:
Bearish engulfing lines
Type : Bearish
Timeframe : Daily
| S2 | S1 | Price | R1 | R2 | R3 | |
|---|---|---|---|---|---|---|
| ProTrendLines | 30.10 | 40.87 | 43.87 | 48.82 | 63.31 | 69.48 |
| Change (%) | -31.39% | -6.84% | - | +11.28% | +44.31% | +58.38% |
| Change | -13.77 | -3.00 | - | +4.95 | +19.44 | +25.61 |
| Level | Minor | Major | - | Intermediate | Minor | Minor |
Attention could also be paid to pivot points to set price objectives:
| Pivot points | S3 | S2 | S1 | PP | R1 | R2 | R3 |
|---|---|---|---|---|---|---|---|
| Standard | 40.75 | 42.18 | 43.06 | 44.49 | 45.37 | 46.80 | 47.68 |
| Camarilla | 43.32 | 43.53 | 43.74 | 43.95 | 44.16 | 44.37 | 44.59 |
| Woodie | 40.49 | 42.04 | 42.80 | 44.35 | 45.11 | 46.66 | 47.42 |
| Fibonacci | 42.18 | 43.06 | 43.60 | 44.49 | 45.37 | 45.91 | 46.80 |
| Pivot points | S3 | S2 | S1 | PP | R1 | R2 | R3 |
|---|---|---|---|---|---|---|---|
| Standard | 1.98 | 2.61 | 3.04 | 3.67 | 4.10 | 4.73 | 5.16 |
| Camarilla | 3.19 | 3.29 | 3.38 | 3.48 | 3.58 | 3.67 | 3.77 |
| Woodie | 1.89 | 2.56 | 2.95 | 3.62 | 4.01 | 4.68 | 5.07 |
| Fibonacci | 2.61 | 3.01 | 3.26 | 3.67 | 4.07 | 4.32 | 4.73 |
| Pivot points | S3 | S2 | S1 | PP | R1 | R2 | R3 |
|---|---|---|---|---|---|---|---|
| Standard | 33.96 | 44.11 | 43.70 | 53.85 | 53.44 | 63.59 | 63.18 |
| Camarilla | 40.62 | 41.51 | 42.41 | 43.30 | 44.19 | 45.09 | 45.98 |
| Woodie | 28.69 | 41.47 | 38.43 | 51.21 | 48.17 | 60.95 | 57.91 |
| Fibonacci | 44.11 | 47.83 | 50.13 | 53.85 | 57.57 | 59.87 | 63.59 |
Numerical data
The following is the status of the technical indicators and moving averages at the time of publication of this technical analysis:
| RSI (14): | 49.99 | |
| MACD (12,26,9): | 0.4800 | |
| Directional Movement: | 13.12 | |
| AROON (14): | 78.57 | |
| DEMA (21): | 44.55 | |
| Parabolic SAR (0,02-0,02-0,2): | 43.58 | |
| Elder Ray (13): | -0.38 | |
| Super Trend (3,10): | 55.88 | |
| Zig ZAG (10): | 44.04 | |
| VORTEX (21): | 0.9400 | |
| Stochastique (14,3,5): | 20.22 | |
| TEMA (21): | 45.33 | |
| Williams %R (14): | -83.19 | |
| Chande Momentum Oscillator (20): | 2.42 | |
| Repulse (5,40,3): | -2.4300 | |
| ROCnROLL: | 2 | |
| TRIX (15,9): | -0.0100 | |
| Courbe Coppock: | 14.08 |
| MA7: | 45.64 | |
| MA20: | 43.37 | |
| MA50: | 44.30 | |
| MA100: | 44.15 | |
| MAexp7: | 45.14 | |
| MAexp20: | 44.15 | |
| MAexp50: | 44.16 | |
| MAexp100: | 45.23 | |
| Price / MA7: | -3.88% | |
| Price / MA20: | +1.15% | |
| Price / MA50: | -0.97% | |
| Price / MA100: | -0.63% | |
| Price / MAexp7: | -2.81% | |
| Price / MAexp20: | -0.63% | |
| Price / MAexp50: | -0.66% | |
| Price / MAexp100: | -3.01% |
About author

Online


Add a comment
Comments
0 comments on the analysis LITECOIN - LTC/USD - Daily