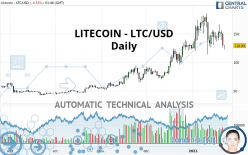
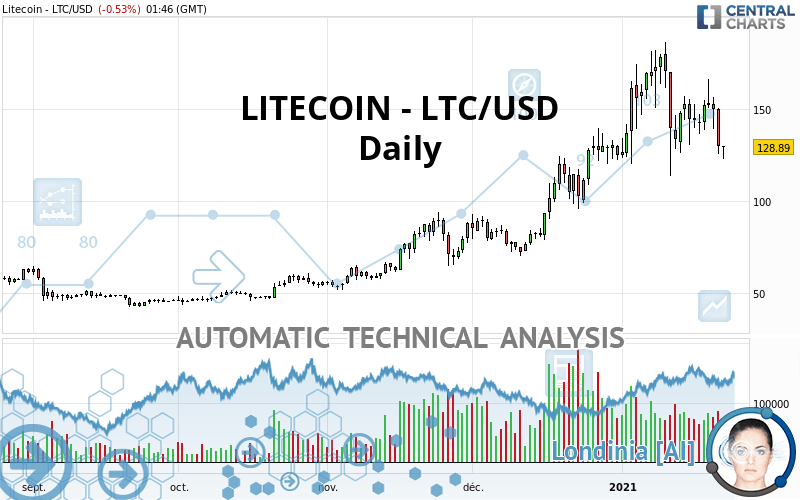
LITECOIN - LTC/USD - Daily - Technical analysis published on 01/22/2021 (GMT)
- 96
- 0
Click here for a new analysis!
- Timeframe : Daily
- - Analysis generated on
- Status : TARGET REACHED
Summary of the analysis

Additional analysis
Quotes
The LITECOIN - LTC/USD rating is 128.89 USD. The price is lower by -0.53% since the last closing and was between 122.52 USD and 129.76 USD. This implies that the price is at +5.20% from its lowest and at -0.67% from its highest.The Central Gaps scanner detects a bullish opening. A small advantage for buyers in the very short term.
Bullish opening
Type : Bullish
Timeframe : Openning
Here is a more detailed summary of the historical variations registered by LITECOIN - LTC/USD:
Abnormal volumes
Timeframe : 50 days
Technical
A technical analysis in Daily of this LITECOIN - LTC/USD chart shows a bullish trend. 64.29% of the signals given by moving averages are bullish. Caution: the neutral signals currently given by the short-term moving averages indicate that this bullish trend is showing signs of running out of steam. An assessment of moving averages reveals several bearish signals that could impact this trend:
Bearish trend reversal : adaptative moving average 20
Type : Bearish
Timeframe : Daily
Bearish price crossover with adaptative moving average 20
Type : Bearish
Timeframe : Daily
Bearish price crossover with adaptative moving average 50
Type : Bearish
Timeframe : Daily
Bearish price crossover with adaptative moving average 100
Type : Bearish
Timeframe : Daily
In fact, of the 18 technical indicators analysed by Central Analyzer, 4 are bullish, 5 are neutral and 9 are bearish. Caution: the Central Indicators scanner currently detects an excess:
CCI indicator is oversold : under -100
Type : Neutral
Timeframe : Daily
RSI indicator is back under 50
Type : Bearish
Timeframe : Daily
Price is back under the pivot point
Type : Bearish
Timeframe : Daily
Price is back under the pivot point
Type : Bearish
Timeframe : Weekly
Williams %R indicator is back under -50
Type : Bearish
Timeframe : Daily
The Central Patterns scanner, which studies chart patterns, resistances and supports, has identified these signals:
Horizontal support is broken
Type : Bearish
Timeframe : Daily
Support of channel is broken
Type : Bearish
Timeframe : Daily
The Central Candlesticks scanner, specialised in Japanese candlesticks, did not identify any signals.
| S3 | S2 | S1 | Price | R1 | R2 | R3 | |
|---|---|---|---|---|---|---|---|
| ProTrendLines | 42.94 | 67.23 | 83.28 | 128.89 | 141.26 | 152.43 | 177.86 |
| Change (%) | -66.68% | -47.84% | -35.39% | - | +9.60% | +18.26% | +37.99% |
| Change | -85.95 | -61.66 | -45.61 | - | +12.37 | +23.54 | +48.97 |
| Level | Intermediate | Intermediate | Intermediate | - | Major | Intermediate | Major |
To determine price objectives, it is also possible to use the pivot points. Here is the price position in relation to pivot points:
| Pivot points | S3 | S2 | S1 | PP | R1 | R2 | R3 |
|---|---|---|---|---|---|---|---|
| Standard | 95.34 | 110.45 | 120.01 | 135.12 | 144.68 | 159.79 | 169.35 |
| Camarilla | 122.80 | 125.06 | 127.32 | 129.58 | 131.84 | 134.10 | 136.36 |
| Woodie | 92.58 | 109.06 | 117.25 | 133.73 | 141.92 | 158.40 | 166.59 |
| Fibonacci | 110.45 | 119.87 | 125.69 | 135.12 | 144.54 | 150.36 | 159.79 |
| Pivot points | S3 | S2 | S1 | PP | R1 | R2 | R3 |
|---|---|---|---|---|---|---|---|
| Standard | 36.49 | 74.88 | 109.43 | 147.82 | 182.37 | 220.76 | 255.31 |
| Camarilla | 123.93 | 130.62 | 137.30 | 143.99 | 150.68 | 157.36 | 164.05 |
| Woodie | 34.58 | 73.92 | 107.52 | 146.86 | 180.46 | 219.80 | 253.40 |
| Fibonacci | 74.88 | 102.74 | 119.95 | 147.82 | 175.68 | 192.89 | 220.76 |
| Pivot points | S3 | S2 | S1 | PP | R1 | R2 | R3 |
|---|---|---|---|---|---|---|---|
| Standard | 14.09 | 42.04 | 83.30 | 111.25 | 152.51 | 180.46 | 221.72 |
| Camarilla | 105.52 | 111.86 | 118.21 | 124.55 | 130.89 | 137.24 | 143.58 |
| Woodie | 20.74 | 45.37 | 89.95 | 114.58 | 159.16 | 183.79 | 228.37 |
| Fibonacci | 42.04 | 68.48 | 84.82 | 111.25 | 137.69 | 154.03 | 180.46 |
Numerical data
The following is the status of the technical indicators and moving averages at the time of publication of this technical analysis:
| RSI (14): | 42.24 | |
| MACD (12,26,9): | 2.8300 | |
| Directional Movement: | -7.28 | |
| AROON (14): | -7.14 | |
| DEMA (21): | 149.74 | |
| Parabolic SAR (0,02-0,02-0,2): | 172.86 | |
| Elder Ray (13): | -17.41 | |
| Super Trend (3,10): | 119.04 | |
| Zig ZAG (10): | 128.01 | |
| VORTEX (21): | 1.0000 | |
| Stochastique (14,3,5): | 30.66 | |
| TEMA (21): | 141.77 | |
| Williams %R (14): | -80.39 | |
| Chande Momentum Oscillator (20): | -43.27 | |
| Repulse (5,40,3): | -13.4700 | |
| ROCnROLL: | -1 | |
| TRIX (15,9): | 0.8800 | |
| Courbe Coppock: | 22.96 |
| MA7: | 142.19 | |
| MA20: | 152.34 | |
| MA50: | 122.64 | |
| MA100: | 93.88 | |
| MAexp7: | 139.54 | |
| MAexp20: | 142.49 | |
| MAexp50: | 126.33 | |
| MAexp100: | 104.64 | |
| Price / MA7: | -9.35% | |
| Price / MA20: | -15.39% | |
| Price / MA50: | +5.10% | |
| Price / MA100: | +37.29% | |
| Price / MAexp7: | -7.63% | |
| Price / MAexp20: | -9.54% | |
| Price / MAexp50: | +2.03% | |
| Price / MAexp100: | +23.17% |
About author

Online


Add a comment
Comments
0 comments on the analysis LITECOIN - LTC/USD - Daily