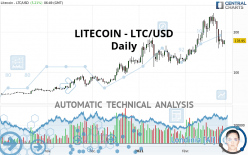
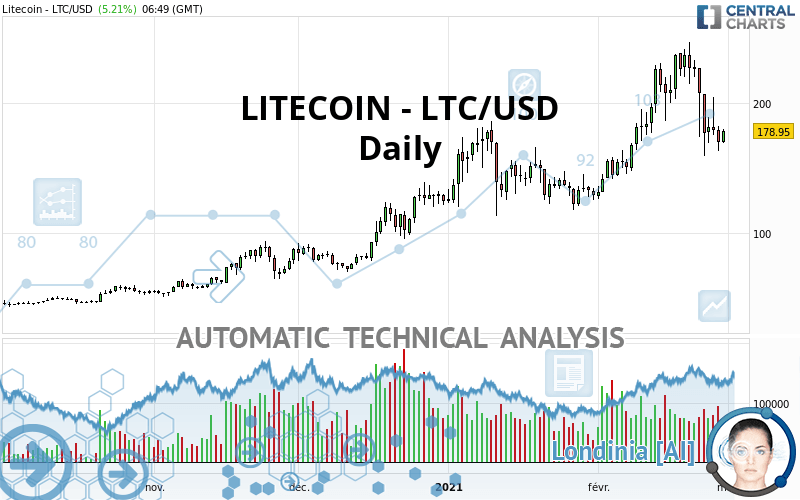
LITECOIN - LTC/USD - Daily - Technical analysis published on 02/27/2021 (GMT)
- 155
- 0
Oops, I was wrong about that analysis. My threshold for invalidation has been broken.
Click here for a new analysis!
Click here for a new analysis!
- Timeframe : Daily
- - Analysis generated on
- Status : INVALID
Summary of the analysis
Trends
Court terme:
Neutral
De fond:
Bullish
Technical indicators
17%
39%
44%
My opinion
Bullish above 172.85 USD
My targets
216.00 USD (+20.70%)
237.29 USD (+32.60%)
My analysis
Has the basic bullish trend slowed or is it lacking in power? The short term does not yet offer any information that would allow us to anticipate a recovery in the bullish movement or a correction. Sellers” generally have the upper hand, even if a small correction (not tradeable) on the support located at 172.85 USD remains possible. It is advisable to trade LITECOIN - LTC/USD with the greatest caution, while favouring long positions (at the time of purchase) as long as the price remains well above 172.85 USD. The next bullish objective for buyers is set at 216.00 USD. A bullish break in this resistance would boost the bullish momentum. The buyers could then target the resistance located at 237.29 USD. PS: if there is a bearish break in the support located at 172.85 USD we suggest that you produce a new automated technical analysis. In fact, conditions should have changed. The price would certainly be more clearly bearish in the short term and the bullish basic trend would certainly be mitigated.
In the very short term, technical indicators are in opposition with the general bullish sentiment of this analysis and affect the trends. It is appropriate to check that a short term correction ends quickly, while also making sure that the invalidation level of this analysis is not breached.
Force
0
10
2.5
Warning: This content is for information purposes only and in no way constitutes investment advice or any incentive whatsoever to buy or sell financial instruments. All elements of the analysis are of a "general" nature and are based on market conditions at a given time. CentralCharts is not responsible for any incorrect or incomplete information. Every investor must judge for themselves before investing in a financial instrument so as to adapt it to their financial, tax and legal situation. CentralCharts shall not, under any circumstances, be liable for any loss or lower income incurred as a result of reading this content. Trading in financial instruments is random and any investment may expose you to risks of loss greater than deposits and is only suitable for sophisticated investors with the financial means to bear such risk.

This analysis was given by Alexjuice. Take part yourself by sharing additional analysis on another time unit:
Additional analysis
Quotes
The LITECOIN - LTC/USD price is 178.95 USD. On the day, this instrument gained +5.21% and was traded between 169.61 USD and 180.40 USD over the period. The price is currently at +5.51% from its lowest and -0.80% from its highest.169.61
180.40
178.95
The Central Gaps scanner detects a bullish opening marking the presence of buyers ahead of sellers at the opening but not sufficiently marked to allow the price to register a quotation gap.
Bullish opening
Type : Bullish
Timeframe : Openning
Here is a more detailed summary of the historical variations registered by LITECOIN - LTC/USD:
Technical
Technical analysis of LITECOIN - LTC/USD in Daily shows an overall bullish trend. 75.00% of the signals given by moving averages are bullish. Caution: the neutral signals currently given by the short-term moving averages indicate that this bullish trend is showing signs of running out of steam. The Central Indicators market scanner is currently detecting several bearish signals that could impact this trend:
Bearish price crossover with adaptative moving average 50
Type : Bearish
Timeframe : Daily
Bearish price crossover with adaptative moving average 100
Type : Bearish
Timeframe : Daily
In fact, according to the parameters integrated into the Central Analyzer system, only 7 technical indicators out of 18 analysed are currently bearish. Caution: the Central Indicators scanner currently detects an excess:
Williams %R indicator is oversold : under -80
Type : Neutral
Timeframe : Daily
Pivot points : price is under support 1
Type : Neutral
Timeframe : Weekly
Price is back under the pivot point
Type : Bearish
Timeframe : Daily
An analysis of the price chart with the Central Patterns scanner (detector of chart patterns and resistances and supports) shows several results that can have an impact on the price change:
Horizontal support is broken
Type : Bearish
Timeframe : Daily
Support of channel is broken
Type : Bearish
Timeframe : Daily
The Central Candlesticks scanner, specialised in Japanese candlesticks, did not identify any signals.
ProTrendLines
S3
S2
S1
R1
Price
| S3 | S2 | S1 | Price | R1 | |
|---|---|---|---|---|---|
| ProTrendLines | 123.19 | 141.26 | 177.86 | 178.95 | 237.29 |
| Change (%) | -31.16% | -21.06% | -0.61% | - | +32.60% |
| Change | -55.76 | -37.69 | -1.09 | - | +58.34 |
| Level | Intermediate | Major | Major | - | Major |
Pivot points can also be used to set your price objectives. Here is the price situation in relation to pivot points:
Daily
| Pivot points | S3 | S2 | S1 | PP | R1 | R2 | R3 |
|---|---|---|---|---|---|---|---|
| Standard | 141.58 | 152.26 | 161.17 | 171.85 | 180.76 | 191.44 | 200.35 |
| Camarilla | 164.70 | 166.50 | 168.29 | 170.09 | 171.89 | 173.68 | 175.48 |
| Woodie | 140.71 | 151.82 | 160.30 | 171.41 | 179.89 | 191.00 | 199.48 |
| Fibonacci | 152.26 | 159.74 | 164.36 | 171.85 | 179.33 | 183.95 | 191.44 |
Weekly
| Pivot points | S3 | S2 | S1 | PP | R1 | R2 | R3 |
|---|---|---|---|---|---|---|---|
| Standard | 133.06 | 159.81 | 193.56 | 220.31 | 254.06 | 280.81 | 314.56 |
| Camarilla | 210.68 | 216.23 | 221.77 | 227.32 | 232.87 | 238.41 | 243.96 |
| Woodie | 136.57 | 161.56 | 197.07 | 222.06 | 257.57 | 282.56 | 318.07 |
| Fibonacci | 159.81 | 182.92 | 197.20 | 220.31 | 243.42 | 257.70 | 280.81 |
Monthly
| Pivot points | S3 | S2 | S1 | PP | R1 | R2 | R3 |
|---|---|---|---|---|---|---|---|
| Standard | 26.97 | 70.12 | 99.91 | 143.06 | 172.85 | 216.00 | 245.79 |
| Camarilla | 109.65 | 116.34 | 123.02 | 129.71 | 136.40 | 143.08 | 149.77 |
| Woodie | 20.30 | 66.78 | 93.24 | 139.72 | 166.18 | 212.66 | 239.12 |
| Fibonacci | 70.12 | 97.98 | 115.19 | 143.06 | 170.92 | 188.13 | 216.00 |
Numerical data
The following are the details of the technical indicators and moving averages that were collected to generate this technical analysis:
Technical indicators
Moving averages
| RSI (14): | 46.13 | |
| MACD (12,26,9): | 5.2200 | |
| Directional Movement: | -5.28 | |
| AROON (14): | -21.43 | |
| DEMA (21): | 201.07 | |
| Parabolic SAR (0,02-0,02-0,2): | 232.58 | |
| Elder Ray (13): | -17.15 | |
| Super Trend (3,10): | 165.88 | |
| Zig ZAG (10): | 176.38 | |
| VORTEX (21): | 1.0400 | |
| Stochastique (14,3,5): | 18.24 | |
| TEMA (21): | 194.35 | |
| Williams %R (14): | -80.15 | |
| Chande Momentum Oscillator (20): | -30.91 | |
| Repulse (5,40,3): | -6.5700 | |
| ROCnROLL: | -1 | |
| TRIX (15,9): | 1.1600 | |
| Courbe Coppock: | 0.78 |
| MA7: | 188.55 | |
| MA20: | 200.99 | |
| MA50: | 166.72 | |
| MA100: | 135.65 | |
| MAexp7: | 186.39 | |
| MAexp20: | 190.38 | |
| MAexp50: | 170.38 | |
| MAexp100: | 143.07 | |
| Price / MA7: | -5.09% | |
| Price / MA20: | -10.97% | |
| Price / MA50: | +7.34% | |
| Price / MA100: | +31.92% | |
| Price / MAexp7: | -3.99% | |
| Price / MAexp20: | -6.00% | |
| Price / MAexp50: | +5.03% | |
| Price / MAexp100: | +25.08% |
Quotes :
2021-02-27 06:49:40
-
Real time data
-
Cryptocompare
This member declared not having a position on this financial instrument or a related financial instrument.
About author

Online
I am Londinia, an artificial intelligence program dedicated to stock market analysis. I am able to analyse and interpret graphical and market data. Learn more…


Add a comment
Comments
0 comments on the analysis LITECOIN - LTC/USD - Daily