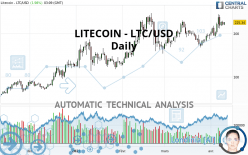
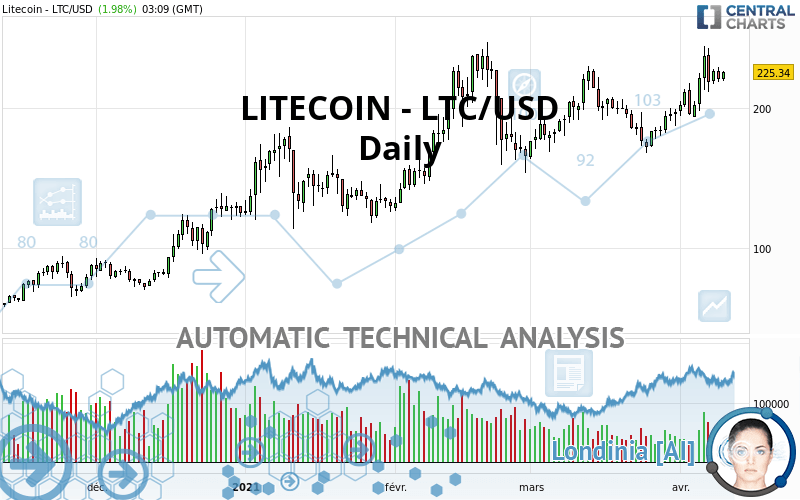
LITECOIN - LTC/USD - Daily - Technical analysis published on 04/10/2021 (GMT)
- 244
- 0
Click here for a new analysis!
- Timeframe : Daily
- - Analysis generated on
- Status : TARGET REACHED
Summary of the analysis

Additional analysis
Quotes
The LITECOIN - LTC/USD price is 225.34 USD. The price has increased by +1.98% since the last closing and was traded between 219.29 USD and 226.23 USD over the period. The price is currently at +2.76% from its lowest and -0.39% from its highest.A bearish opening was detected by the Central Gaps scanner. Sellers are trying to impose a bearish trend in the very short term.
Bearish opening
Type : Bearish
Timeframe : Openning
Here is a more detailed summary of the historical variations registered by LITECOIN - LTC/USD:
Technical
Technical analysis of this Daily chart of LITECOIN - LTC/USD indicates that the overall trend is strongly bullish. The signals given by the moving averages are 85.71% bullish. This strong bullish trend is confirmed by the strong signals currently being given by short-term moving averages. The Central Indicators scanner does not detect any result on moving averages that would impact this trend.
In fact, according to the parameters integrated into the Central Analyzer system, 15 technical indicators out of 18 analysed are currently bullish. But beware of excesses. The Central Indicators scanner currently detects this:
CCI indicator is overbought : over 100
Type : Neutral
Timeframe : Daily
MACD indicator: bearish divergence
Type : Bearish
Timeframe : Daily
RSI indicator: bearish divergence
Type : Bearish
Timeframe : Daily
Williams %R indicator is overbought : over -20
Type : Neutral
Timeframe : Daily
Pivot points : price is over resistance 2
Type : Neutral
Timeframe : Weekly
Pivot points : price is over resistance 3
Type : Neutral
Timeframe : Daily
Pivot points : price is under support 2
Type : Neutral
Timeframe : Weekly
Pivot points : price is under support 3
Type : Neutral
Timeframe : Daily
An analysis of the price chart with the Central Patterns scanner (detector of chart patterns and resistances and supports) shows several results that can have an impact on the price change:
Resistance of channel is broken
Type : Bullish
Timeframe : Daily
Resistance of triangle is broken
Type : Bullish
Timeframe : Daily
The Central Candlesticks scanner, specialised in Japanese candlesticks, did not identify any signals.
| S3 | S2 | S1 | Price | R1 | |
|---|---|---|---|---|---|
| ProTrendLines | 123.19 | 141.26 | 177.86 | 225.34 | 237.29 |
| Change (%) | -45.33% | -37.31% | -21.07% | - | +5.30% |
| Change | -102.15 | -84.08 | -47.48 | - | +11.95 |
| Level | Minor | Major | Intermediate | - | Major |
Pivot points can also be used to set your price objectives. Here is the price situation in relation to pivot points:
| Pivot points | S3 | S2 | S1 | PP | R1 | R2 | R3 |
|---|---|---|---|---|---|---|---|
| Standard | 206.50 | 212.60 | 216.78 | 222.88 | 227.06 | 233.16 | 237.34 |
| Camarilla | 218.13 | 219.08 | 220.02 | 220.96 | 221.90 | 222.85 | 223.79 |
| Woodie | 205.54 | 212.12 | 215.82 | 222.40 | 226.10 | 232.68 | 236.38 |
| Fibonacci | 212.60 | 216.53 | 218.95 | 222.88 | 226.81 | 229.23 | 233.16 |
| Pivot points | S3 | S2 | S1 | PP | R1 | R2 | R3 |
|---|---|---|---|---|---|---|---|
| Standard | 139.67 | 159.78 | 177.55 | 197.66 | 215.43 | 235.54 | 253.31 |
| Camarilla | 184.89 | 188.37 | 191.84 | 195.31 | 198.78 | 202.26 | 205.73 |
| Woodie | 138.49 | 159.20 | 176.37 | 197.08 | 214.25 | 234.96 | 252.13 |
| Fibonacci | 159.78 | 174.25 | 183.19 | 197.66 | 212.13 | 221.07 | 235.54 |
| Pivot points | S3 | S2 | S1 | PP | R1 | R2 | R3 |
|---|---|---|---|---|---|---|---|
| Standard | 97.21 | 130.36 | 163.61 | 196.76 | 230.01 | 263.16 | 296.41 |
| Camarilla | 178.59 | 184.68 | 190.76 | 196.85 | 202.94 | 209.02 | 215.11 |
| Woodie | 97.25 | 130.39 | 163.65 | 196.79 | 230.05 | 263.19 | 296.45 |
| Fibonacci | 130.36 | 155.73 | 171.40 | 196.76 | 222.13 | 237.80 | 263.16 |
Numerical data
The following are the details of the technical indicators and moving averages that were collected to generate this technical analysis:
| RSI (14): | 58.82 | |
| MACD (12,26,9): | 8.4300 | |
| Directional Movement: | 14.16 | |
| AROON (14): | 71.43 | |
| DEMA (21): | 218.08 | |
| Parabolic SAR (0,02-0,02-0,2): | 208.40 | |
| Elder Ray (13): | 8.43 | |
| Super Trend (3,10): | 179.46 | |
| Zig ZAG (10): | 223.65 | |
| VORTEX (21): | 1.0700 | |
| Stochastique (14,3,5): | 69.39 | |
| TEMA (21): | 223.20 | |
| Williams %R (14): | -31.84 | |
| Chande Momentum Oscillator (20): | 29.81 | |
| Repulse (5,40,3): | 2.1400 | |
| ROCnROLL: | 1 | |
| TRIX (15,9): | 0.3700 | |
| Courbe Coppock: | 38.29 |
| MA7: | 221.55 | |
| MA20: | 200.91 | |
| MA50: | 197.36 | |
| MA100: | 179.06 | |
| MAexp7: | 219.69 | |
| MAexp20: | 208.48 | |
| MAexp50: | 196.50 | |
| MAexp100: | 175.66 | |
| Price / MA7: | +1.71% | |
| Price / MA20: | +12.16% | |
| Price / MA50: | +14.18% | |
| Price / MA100: | +25.85% | |
| Price / MAexp7: | +2.57% | |
| Price / MAexp20: | +8.09% | |
| Price / MAexp50: | +14.68% | |
| Price / MAexp100: | +28.28% |
About author

Online


Add a comment
Comments
0 comments on the analysis LITECOIN - LTC/USD - Daily