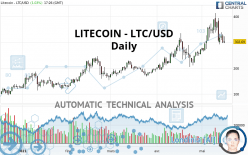
LITECOIN - LTC/USD - Daily - Technical analysis published on 05/16/2021 (GMT)
- 259
- 0
Click here for a new analysis!
- Timeframe : Daily
- - Analysis generated on
- Status : INVALID

Summary of the analysis

Additional analysis
Quotes
The LITECOIN - LTC/USD rating is 302.69 USD. The price has increased by +1.03% since the last closing with the lowest point at 297.19 USD and the highest point at 323.68 USD. The deviation from the price is +1.85% for the low point and -6.48% for the high point.The Central Gaps scanner detects a bullish opening marking the presence of buyers ahead of sellers at the opening but not sufficiently marked to allow the price to register a quotation gap.
Bullish opening
Type : Bullish
Timeframe : Openning
A study of price movements over other periods shows the following variations:
Technical
Technical analysis of LITECOIN - LTC/USD in Daily shows an overall bullish trend. 75.00% of the signals given by moving averages are bullish. Caution: the neutral signals currently given by short-term moving averages show us that the global trend is losing momentum. The Central Indicators market scanner is currently detecting several bearish signals that could impact this trend:
Bearish trend reversal : adaptative moving average 20
Type : Bearish
Timeframe : Daily
Bearish price crossover with Moving Average 20
Type : Bearish
Timeframe : Daily
Bearish price crossover with adaptative moving average 20
Type : Bearish
Timeframe : Daily
An assessment of technical indicators shows a slightly bearish signal.
Central Indicators, the detector scanner for these technical indicators has recently detected several signals:
Pivot points : price is under support 1
Type : Neutral
Timeframe : Daily
RSI indicator is back under 50
Type : Bearish
Timeframe : Daily
MACD crosses DOWN its Moving Average
Type : Bearish
Timeframe : Daily
Price is back over the pivot point
Type : Bullish
Timeframe : Daily
Price is back over the pivot point
Type : Bullish
Timeframe : Weekly
Price is back under the pivot point
Type : Bearish
Timeframe : Weekly
Central Patterns, the scanner specializing in chart patterns, did not identify any signals.
For a small setback in the very short term, the Central Candlesticks scanner currently notes the presence of this bearish pattern in Japanese candlesticks:
Bearish engulfing lines
Type : Bearish
Timeframe : Daily
| S3 | S2 | S1 | Price | R1 | R2 | R3 | |
|---|---|---|---|---|---|---|---|
| ProTrendLines | 123.19 | 171.76 | 237.29 | 302.69 | 309.26 | 356.13 | 387.96 |
| Change (%) | -59.30% | -43.26% | -21.61% | - | +2.17% | +17.66% | +28.17% |
| Change | -179.50 | -130.93 | -65.40 | - | +6.57 | +53.44 | +85.27 |
| Level | Minor | Intermediate | Major | - | Major | Minor | Major |
Attention could also be paid to pivot points to set price objectives:
| Pivot points | S3 | S2 | S1 | PP | R1 | R2 | R3 |
|---|---|---|---|---|---|---|---|
| Standard | 252.13 | 274.50 | 287.05 | 309.42 | 321.97 | 344.34 | 356.89 |
| Camarilla | 290.01 | 293.21 | 296.41 | 299.61 | 302.81 | 306.01 | 309.21 |
| Woodie | 247.23 | 272.05 | 282.15 | 306.97 | 317.07 | 341.89 | 351.99 |
| Fibonacci | 274.50 | 287.84 | 296.08 | 309.42 | 322.76 | 331.00 | 344.34 |
| Pivot points | S3 | S2 | S1 | PP | R1 | R2 | R3 |
|---|---|---|---|---|---|---|---|
| Standard | 134.81 | 213.32 | 256.46 | 334.97 | 378.11 | 456.62 | 499.76 |
| Camarilla | 266.16 | 277.31 | 288.46 | 299.61 | 310.76 | 321.91 | 333.06 |
| Woodie | 117.14 | 204.48 | 238.79 | 326.13 | 360.44 | 447.78 | 482.09 |
| Fibonacci | 213.32 | 259.79 | 288.50 | 334.97 | 381.44 | 410.15 | 456.62 |
| Pivot points | S3 | S2 | S1 | PP | R1 | R2 | R3 |
|---|---|---|---|---|---|---|---|
| Standard | 56.44 | 124.94 | 198.32 | 266.82 | 340.20 | 408.70 | 482.08 |
| Camarilla | 232.68 | 245.69 | 258.69 | 271.70 | 284.71 | 297.71 | 310.72 |
| Woodie | 58.88 | 126.16 | 200.76 | 268.04 | 342.64 | 409.92 | 484.52 |
| Fibonacci | 124.94 | 179.14 | 212.62 | 266.82 | 321.02 | 354.50 | 408.70 |
Numerical data
The following are the details of the technical indicators and moving averages that were collected to generate this technical analysis:
| RSI (14): | 49.51 | |
| MACD (12,26,9): | 16.3100 | |
| Directional Movement: | 7.11 | |
| AROON (14): | 57.14 | |
| DEMA (21): | 336.37 | |
| Parabolic SAR (0,02-0,02-0,2): | 397.45 | |
| Elder Ray (13): | -8.58 | |
| Super Trend (3,10): | 261.59 | |
| Zig ZAG (10): | 299.55 | |
| VORTEX (21): | 1.1100 | |
| Stochastique (14,3,5): | 28.47 | |
| TEMA (21): | 334.09 | |
| Williams %R (14): | -79.17 | |
| Chande Momentum Oscillator (20): | -6.10 | |
| Repulse (5,40,3): | -16.6600 | |
| ROCnROLL: | -1 | |
| TRIX (15,9): | 1.2200 | |
| Courbe Coppock: | 38.78 |
| MA7: | 326.70 | |
| MA20: | 313.65 | |
| MA50: | 268.41 | |
| MA100: | 231.37 | |
| MAexp7: | 318.38 | |
| MAexp20: | 312.03 | |
| MAexp50: | 277.15 | |
| MAexp100: | 237.80 | |
| Price / MA7: | -7.35% | |
| Price / MA20: | -3.49% | |
| Price / MA50: | +12.77% | |
| Price / MA100: | +30.83% | |
| Price / MAexp7: | -4.93% | |
| Price / MAexp20: | -2.99% | |
| Price / MAexp50: | +9.22% | |
| Price / MAexp100: | +27.29% |
About author

Online


Add a comment
Comments
0 comments on the analysis LITECOIN - LTC/USD - Daily