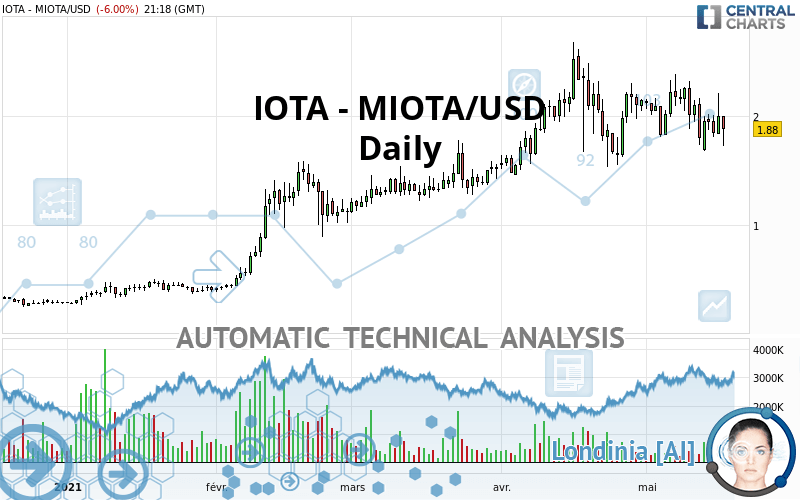
IOTA - MIOTA/USD - Daily - Technical analysis published on 05/17/2021 (GMT)
- 191
- 0
Click here for a new analysis!
- Timeframe : Daily
- - Analysis generated on
- Status : TARGET REACHED

Summary of the analysis

Additional analysis
Quotes
IOTA - MIOTA/USD rating 1.88 USD. The price is lower by -6.00% since the last closing and was between 1.73 USD and 2.00 USD. This implies that the price is at +8.67% from its lowest and at -6.00% from its highest.A bullish opening was detected by the Central Gaps scanner. Buyers are trying to impose a bullish momentum in the very short term.
Bullish opening
Type : Bullish
Timeframe : Openning
Here is a more detailed summary of the historical variations registered by IOTA - MIOTA/USD:
Technical
A technical analysis in Daily of this IOTA - MIOTA/USD chart shows a slightly bullish trend. 57.14% of the signals given by moving averages are bullish. Caution: the strong bearish signals currently being given by short-term moving averages indicate that this slightly bullish trend could be reversed. The Central Indicators market scanner is currently detecting several bullish signals that could impact this trend:
Bullish price crossover with Moving Average 50
Type : Bullish
Timeframe : Daily
Bullish price crossover with adaptative moving average 20
Type : Bullish
Timeframe : Daily
Bullish price crossover with adaptative moving average 50
Type : Bullish
Timeframe : Daily
Bullish price crossover with adaptative moving average 100
Type : Bullish
Timeframe : Daily
In fact, according to the parameters integrated into the Central Analyzer system, only 8 technical indicators out of 18 analysed are currently bearish. Central Indicators, the detector scanner for these technical indicators has recently detected several signals:
Pivot points : price is under support 1
Type : Neutral
Timeframe : Weekly
RSI indicator is back over 50
Type : Bullish
Timeframe : Daily
Momentum indicator is back over 0
Type : Bullish
Timeframe : Daily
Central Patterns, the market scanner focusing on chart patterns, resistances and supports found these results:
Horizontal support is broken
Type : Bearish
Timeframe : Daily
Support of channel is broken
Type : Bearish
Timeframe : Daily
For a small rebound in the very short term, the Central Candlesticks scanner currently notes the presence of this bullish pattern in Japanese candlesticks:
Bullish engulfing lines
Type : Bullish
Timeframe : Daily
| S3 | S2 | S1 | Price | R1 | R2 | |
|---|---|---|---|---|---|---|
| ProTrendLines | 1.09 | 1.49 | 1.83 | 1.88 | 2.26 | 2.52 |
| Change (%) | -42.02% | -20.74% | -2.66% | - | +20.21% | +34.04% |
| Change | -0.79 | -0.39 | -0.05 | - | +0.38 | +0.64 |
| Level | Minor | Major | Major | - | Minor | Intermediate |
Pivot points can also be used to set your price objectives. Here is the price situation in relation to pivot points:
| Pivot points | S3 | S2 | S1 | PP | R1 | R2 | R3 |
|---|---|---|---|---|---|---|---|
| Standard | 1.45 | 1.65 | 1.82 | 2.02 | 2.19 | 2.39 | 2.56 |
| Camarilla | 1.90 | 1.93 | 1.97 | 2.00 | 2.03 | 2.07 | 2.10 |
| Woodie | 1.45 | 1.64 | 1.82 | 2.01 | 2.19 | 2.38 | 2.56 |
| Fibonacci | 1.65 | 1.79 | 1.88 | 2.02 | 2.16 | 2.25 | 2.39 |
| Pivot points | S3 | S2 | S1 | PP | R1 | R2 | R3 |
|---|---|---|---|---|---|---|---|
| Standard | 0.94 | 1.31 | 1.58 | 1.95 | 2.22 | 2.59 | 2.86 |
| Camarilla | 1.67 | 1.73 | 1.79 | 1.85 | 1.91 | 1.97 | 2.03 |
| Woodie | 0.89 | 1.29 | 1.53 | 1.93 | 2.17 | 2.57 | 2.81 |
| Fibonacci | 1.31 | 1.55 | 1.71 | 1.95 | 2.19 | 2.35 | 2.59 |
| Pivot points | S3 | S2 | S1 | PP | R1 | R2 | R3 |
|---|---|---|---|---|---|---|---|
| Standard | 0.29 | 0.88 | 1.51 | 2.10 | 2.73 | 3.32 | 3.95 |
| Camarilla | 1.82 | 1.93 | 2.04 | 2.15 | 2.26 | 2.37 | 2.49 |
| Woodie | 0.32 | 0.89 | 1.54 | 2.11 | 2.76 | 3.33 | 3.98 |
| Fibonacci | 0.88 | 1.34 | 1.63 | 2.10 | 2.56 | 2.85 | 3.32 |
Numerical data
The following is the status of the technical indicators and moving averages at the time of publication of this technical analysis:
| RSI (14): | 46.28 | |
| MACD (12,26,9): | -0.0100 | |
| Directional Movement: | -6.16 | |
| AROON (14): | -42.86 | |
| DEMA (21): | 2.00 | |
| Parabolic SAR (0,02-0,02-0,2): | 2.34 | |
| Elder Ray (13): | -0.12 | |
| Super Trend (3,10): | 2.62 | |
| Zig ZAG (10): | 1.90 | |
| VORTEX (21): | 1.0200 | |
| Stochastique (14,3,5): | 33.08 | |
| TEMA (21): | 1.93 | |
| Williams %R (14): | -67.90 | |
| Chande Momentum Oscillator (20): | -0.12 | |
| Repulse (5,40,3): | -1.0800 | |
| ROCnROLL: | -1 | |
| TRIX (15,9): | 0.1200 | |
| Courbe Coppock: | 11.17 |
| MA7: | 1.94 | |
| MA20: | 2.05 | |
| MA50: | 1.96 | |
| MA100: | 1.61 | |
| MAexp7: | 1.96 | |
| MAexp20: | 2.00 | |
| MAexp50: | 1.89 | |
| MAexp100: | 1.61 | |
| Price / MA7: | -3.09% | |
| Price / MA20: | -8.29% | |
| Price / MA50: | -4.08% | |
| Price / MA100: | +16.77% | |
| Price / MAexp7: | -4.08% | |
| Price / MAexp20: | -6.00% | |
| Price / MAexp50: | -0.53% | |
| Price / MAexp100: | +16.77% |
About author

Online


Add a comment
Comments
0 comments on the analysis IOTA - MIOTA/USD - Daily