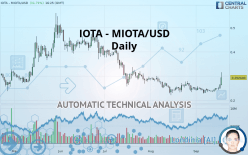
IOTA - MIOTA/USD - Daily - Technical analysis published on 09/18/2019 (GMT)
- 237
- 0
Click here for a new analysis!
- Timeframe : Daily
- - Analysis generated on
- Status : INVALID

Summary of the analysis

Additional analysis
Quotes
The IOTA - MIOTA/USD rating is 0.292608 USD. The price has increased by +11.71% since the last closing with the lowest point at 0.261206 USD and the highest point at 0.314620 USD. The deviation from the price is +12.02% for the low point and -7.00% for the high point.So that you have an overall view of the price change, here is a table showing the variations over several periods:
Technical
Technical analysis of this Daily chart of IOTA - MIOTA/USD indicates that the overall trend is not clearly defined. The trend could quickly turn bullish due to the strong bullish signals currently being given by short-term moving averages. An assessment of moving averages reveals several bullish signals that could impact this trend:
Bullish price crossover with Moving Average 20
Type : Bullish
Timeframe : Daily
Bullish price crossover with Moving Average 50
Type : Bullish
Timeframe : Daily
In fact, 13 technical indicators on 18 studied are currently bullish. But beware of excesses. The Central Indicators scanner currently detects this:
Williams %R indicator is oversold : under -80
Type : Neutral
Timeframe : Daily
Williams %R indicator is overbought : over -20
Type : Neutral
Timeframe : Daily
Pivot points : price is over resistance 3
Type : Neutral
Timeframe : Daily
Pivot points : price is over resistance 3
Type : Neutral
Timeframe : Weekly
RSI indicator is back over 50
Type : Bullish
Timeframe : Daily
An analysis of the price chart with the Central Patterns scanner (detector of chart patterns and resistances and supports) shows several results that can have an impact on the price change:
Near resistance of triangle
Type : Bearish
Timeframe : Daily
Horizontal resistance is broken
Type : Bullish
Timeframe : Daily
Resistance of channel is broken
Type : Bullish
Timeframe : Daily
The Central Candlesticks scanner which studies Japanese candlesticks did not detect anything.
| S2 | S1 | Price | R1 | R2 | R3 | |
|---|---|---|---|---|---|---|
| ProTrendLines | 0.239211 | 0.268841 | 0.292608 | 0.405593 | 0.460696 | 0.512869 |
| Change (%) | -18.25% | -8.12% | - | +38.61% | +57.44% | +75.28% |
| Change | -0.053397 | -0.023767 | - | +0.112985 | +0.168088 | +0.220261 |
| Level | Major | Intermediate | - | Minor | Minor | Intermediate |
Pivot points can also be used to set your price objectives. Here is the price situation in relation to pivot points:
| Pivot points | S3 | S2 | S1 | PP | R1 | R2 | R3 |
|---|---|---|---|---|---|---|---|
| Standard | 0.233047 | 0.240303 | 0.251123 | 0.258379 | 0.269199 | 0.276455 | 0.287275 |
| Camarilla | 0.256973 | 0.258630 | 0.260287 | 0.261944 | 0.263601 | 0.265258 | 0.266915 |
| Woodie | 0.234830 | 0.241194 | 0.252906 | 0.259270 | 0.270982 | 0.277346 | 0.289058 |
| Fibonacci | 0.240303 | 0.247208 | 0.251474 | 0.258379 | 0.265284 | 0.269550 | 0.276455 |
| Pivot points | S3 | S2 | S1 | PP | R1 | R2 | R3 |
|---|---|---|---|---|---|---|---|
| Standard | 0.220797 | 0.226891 | 0.237264 | 0.243358 | 0.253731 | 0.259825 | 0.270198 |
| Camarilla | 0.243109 | 0.244618 | 0.246128 | 0.247637 | 0.249147 | 0.250656 | 0.252165 |
| Woodie | 0.222937 | 0.227961 | 0.239404 | 0.244428 | 0.255871 | 0.260895 | 0.272338 |
| Fibonacci | 0.226891 | 0.233181 | 0.237068 | 0.243358 | 0.249648 | 0.253535 | 0.259825 |
| Pivot points | S3 | S2 | S1 | PP | R1 | R2 | R3 |
|---|---|---|---|---|---|---|---|
| Standard | 0.264303 | 0.323701 | 0.286603 | 0.346001 | 0.308903 | 0.368301 | 0.331203 |
| Camarilla | 0.243372 | 0.245416 | 0.247460 | 0.249504 | 0.251548 | 0.253592 | 0.255637 |
| Woodie | 0.216054 | 0.299577 | 0.238354 | 0.321877 | 0.260654 | 0.344177 | 0.282954 |
| Fibonacci | 0.323701 | 0.332220 | 0.337483 | 0.346001 | 0.354520 | 0.359783 | 0.368301 |
Numerical data
The following is the status of the technical indicators and moving averages at the time of publication of this technical analysis:
| RSI (14): | 55.20 | |
| MACD (12,26,9): | 0.0067 | |
| Directional Movement: | 13.160519 | |
| AROON (14): | 71.428569 | |
| DEMA (21): | 0.267321 | |
| Parabolic SAR (0,02-0,02-0,2): | 0.237422 | |
| Elder Ray (13): | 0.021441 | |
| Super Trend (3,10): | 0.358212 | |
| Zig ZAG (10): | 0.292698 | |
| VORTEX (21): | 1.0459 | |
| Stochastique (14,3,5): | 23.21 | |
| TEMA (21): | 0.280855 | |
| Williams %R (14): | -62.72 | |
| Chande Momentum Oscillator (20): | 0.052553 | |
| Repulse (5,40,3): | 14.5373 | |
| ROCnROLL: | 1 | |
| TRIX (15,9): | 0.0405 | |
| Courbe Coppock: | 24.76 |
| MA7: | 0.275903 | |
| MA20: | 0.253710 | |
| MA50: | 0.258142 | |
| MA100: | 0.314423 | |
| MAexp7: | 0.275559 | |
| MAexp20: | 0.261980 | |
| MAexp50: | 0.269460 | |
| MAexp100: | 0.293977 | |
| Price / MA7: | +6.05% | |
| Price / MA20: | +15.33% | |
| Price / MA50: | +13.35% | |
| Price / MA100: | -6.94% | |
| Price / MAexp7: | +6.19% | |
| Price / MAexp20: | +11.69% | |
| Price / MAexp50: | +8.59% | |
| Price / MAexp100: | -0.47% |
About author

Online


Add a comment
Comments
0 comments on the analysis IOTA - MIOTA/USD - Daily