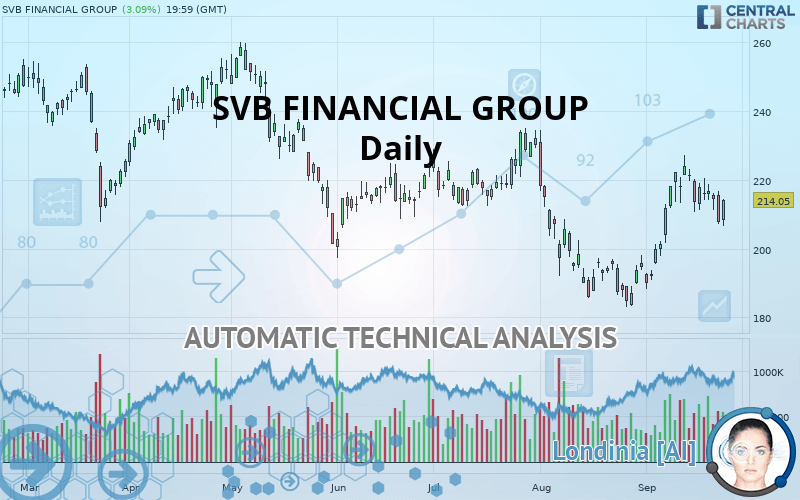
SVB FINANCIAL GROUP - Daily - Technical analysis published on 09/26/2019 (GMT)
- Who voted?
- 325
- 0
Click here for a new analysis!
- Timeframe : Daily
- - Analysis generated on
- Status : INVALID

Summary of the analysis
Additional analysis
Quotes
The SVB FINANCIAL GROUP price is 214.05 USD. On the day, this instrument gained +3.09% and was traded between 206.42 USD and 214.36 USD over the period. The price is currently at +3.70% from its lowest and -0.14% from its highest.The Central Gaps scanner detects a bullish opening. A small advantage for buyers in the very short term.
Bullish opening
Type : Bullish
Timeframe : Openning
A study of price movements over other periods shows the following variations:
Technical
A technical analysis in Daily of this SVB FINANCIAL GROUP chart shows a neutral trend. The strong bullish signals currently being given by short-term moving averages could allow the overall trend to return to bullish. The Central Indicators market scanner is currently detecting several bearish signals that could impact this trend:
Bearish trend reversal : adaptative moving average 100
Type : Bearish
Timeframe : Daily
Bearish price crossover with Moving Average 50
Type : Bearish
Timeframe : Daily
Bearish price crossover with adaptative moving average 20
Type : Bearish
Timeframe : Daily
Bearish price crossover with adaptative moving average 50
Type : Bearish
Timeframe : Daily
The probability of a further increase is slight given the direction of the technical indicators.
Central Indicators, the detector scanner for these technical indicators has recently detected several signals:
Pivot points : price is over resistance 1
Type : Neutral
Timeframe : Daily
RSI indicator is back under 50
Type : Bearish
Timeframe : Daily
Price is back under the pivot point
Type : Bearish
Timeframe : Daily
Price is back under the pivot point
Type : Bearish
Timeframe : Weekly
Williams %R indicator is back under -50
Type : Bearish
Timeframe : Daily
No signals are given by Central Patterns, a market scanner specialised in chart patterns, resistances and supports.
The Central Candlesticks scanner which studies Japanese candlesticks did not detect anything.
| S3 | S2 | S1 | Price | R1 | R2 | R3 | |
|---|---|---|---|---|---|---|---|
| ProTrendLines | 180.49 | 199.51 | 212.34 | 214.05 | 224.30 | 233.72 | 250.62 |
| Change (%) | -15.68% | -6.79% | -0.80% | - | +4.79% | +9.19% | +17.08% |
| Change | -33.56 | -14.54 | -1.71 | - | +10.25 | +19.67 | +36.57 |
| Level | Major | Major | Major | - | Intermediate | Major | Intermediate |
To determine price objectives, it is also possible to use the pivot points. Here is the price position in relation to pivot points:
| Pivot points | S3 | S2 | S1 | PP | R1 | R2 | R3 |
|---|---|---|---|---|---|---|---|
| Standard | 194.55 | 200.85 | 204.24 | 210.54 | 213.93 | 220.23 | 223.62 |
| Camarilla | 204.97 | 205.85 | 206.74 | 207.63 | 208.52 | 209.41 | 210.30 |
| Woodie | 193.10 | 200.12 | 202.79 | 209.81 | 212.48 | 219.50 | 222.17 |
| Fibonacci | 200.85 | 204.55 | 206.84 | 210.54 | 214.24 | 216.53 | 220.23 |
| Pivot points | S3 | S2 | S1 | PP | R1 | R2 | R3 |
|---|---|---|---|---|---|---|---|
| Standard | 198.30 | 204.53 | 210.55 | 216.78 | 222.80 | 229.03 | 235.05 |
| Camarilla | 213.21 | 214.33 | 215.46 | 216.58 | 217.70 | 218.83 | 219.95 |
| Woodie | 198.21 | 204.48 | 210.46 | 216.73 | 222.71 | 228.98 | 234.96 |
| Fibonacci | 204.53 | 209.21 | 212.10 | 216.78 | 221.46 | 224.35 | 229.03 |
| Pivot points | S3 | S2 | S1 | PP | R1 | R2 | R3 |
|---|---|---|---|---|---|---|---|
| Standard | 122.35 | 152.70 | 173.66 | 204.00 | 224.96 | 255.31 | 276.27 |
| Camarilla | 180.51 | 185.21 | 189.92 | 194.62 | 199.32 | 204.03 | 208.73 |
| Woodie | 117.66 | 150.35 | 168.97 | 201.66 | 220.27 | 252.96 | 271.58 |
| Fibonacci | 152.70 | 172.30 | 184.40 | 204.00 | 223.60 | 235.71 | 255.31 |
Numerical data
The following is the status of technical indicators and moving averages registered at the time this technical analysis was created:
| RSI (14): | 54.01 | |
| MACD (12,26,9): | 3.4300 | |
| Directional Movement: | -0.37 | |
| AROON (14): | 42.86 | |
| DEMA (21): | 214.60 | |
| Parabolic SAR (0,02-0,02-0,2): | 226.17 | |
| Elder Ray (13): | -2.24 | |
| Super Trend (3,10): | 202.12 | |
| Zig ZAG (10): | 214.05 | |
| VORTEX (21): | 1.0400 | |
| Stochastique (14,3,5): | 53.74 | |
| TEMA (21): | 218.66 | |
| Williams %R (14): | -44.76 | |
| Chande Momentum Oscillator (20): | 2.32 | |
| Repulse (5,40,3): | 1.5500 | |
| ROCnROLL: | 1 | |
| TRIX (15,9): | 0.2400 | |
| Courbe Coppock: | 18.43 |
| MA7: | 214.45 | |
| MA20: | 208.75 | |
| MA50: | 207.76 | |
| MA100: | 215.16 | |
| MAexp7: | 213.94 | |
| MAexp20: | 210.57 | |
| MAexp50: | 209.65 | |
| MAexp100: | 215.24 | |
| Price / MA7: | -0.19% | |
| Price / MA20: | +2.54% | |
| Price / MA50: | +3.03% | |
| Price / MA100: | -0.52% | |
| Price / MAexp7: | +0.05% | |
| Price / MAexp20: | +1.65% | |
| Price / MAexp50: | +2.10% | |
| Price / MAexp100: | -0.55% |
News
Don"t forget to follow the news on SVB FINANCIAL GROUP. At the time of publication of this analysis, the latest news was as follows:
- SVB Financial Group Appoints Kay Matthews, formerly of Ernst & Young, to its Board of Directors
- SVB Financial Group Announces Availability Of Quarterly Financial Results
- SVB Financial Group Confirms Date And Time Of Quarterly Earnings Call
- SVB Financial Group Announces Availability Of Quarterly Financial Results
- SVB Financial Group Appoints New Leadership in Funds Management and Commercial Banking with Eye Toward Growth
About author

Online


Add a comment
Comments
0 comments on the analysis SVB FINANCIAL GROUP - Daily