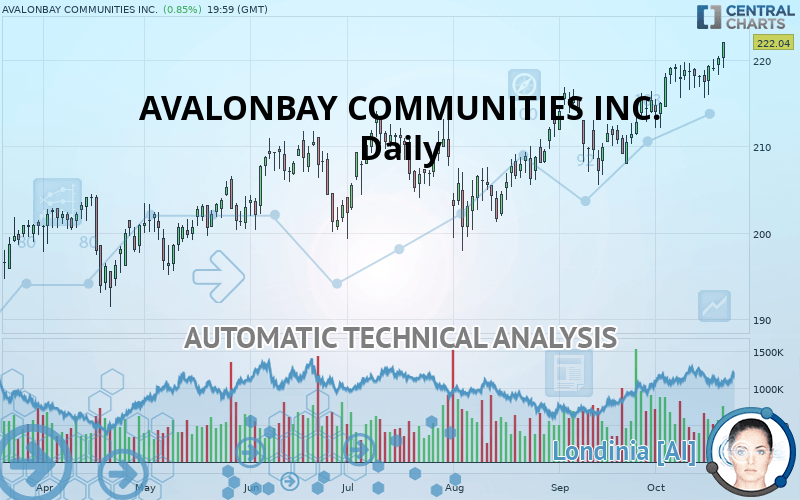
AVALONBAY COMMUNITIES INC. - Daily - Technical analysis published on 10/21/2019 (GMT)
- Who voted?
- 215
- 0
Oops, I was wrong about that analysis. My threshold for invalidation has been broken.
Click here for a new analysis!
Click here for a new analysis!
- Timeframe : Daily
- - Analysis generated on
- Status : INVALID

Summary of the analysis
Trends
Court terme:
Strongly bullish
De fond:
Strongly bullish
Technical indicators
78%
0%
22%
My opinion
Bullish above 219.20 USD
My targets
224.20 USD (+0.97%)
232.06 USD (+4.51%)
My analysis
AVALONBAY COMMUNITIES INC. is part of a very strong bullish trend. Traders may consider trading only long positions (at the time of purchase) as long as the price remains well above 219.20 USD. The next resistance located at 224.20 USD is the next bullish objective to be reached. A bullish break in this resistance would boost the bullish momentum. The bullish movement could then continue towards the next resistance located at 232.06 USD. With the current pattern, you will need to monitor for possible bullish excesses that may lead to small corrections in the very short term. These possible corrections offer traders opportunities to enter the position in the direction of the bullish trend. Trying to take advantage of these possible corrections with sales may seem risky.
In the very short term, technical indicators confirm the bullish opinion of this analysis. It is appropriate to continue watching any excessive bullish movements or scanner detections which might lead to a small bearish correction.
FORCE
0
10
8.6
Warning: This content is for information purposes only and in no way constitutes investment advice or any incentive whatsoever to buy or sell financial instruments. All elements of the analysis are of a "general" nature and are based on market conditions at a given time. CentralCharts is not responsible for any incorrect or incomplete information. Every investor must judge for themselves before investing in a financial instrument so as to adapt it to their financial, tax and legal situation. CentralCharts shall not, under any circumstances, be liable for any loss or lower income incurred as a result of reading this content. Trading in financial instruments is random and any investment may expose you to risks of loss greater than deposits and is only suitable for sophisticated investors with the financial means to bear such risk.

This analysis was given by Vincent Launay. Take part yourself by sharing additional analysis on another time unit:
Additional analysis
Quotes
The AVALONBAY COMMUNITIES INC. price is 222.04 USD. On the day, this instrument gained +0.85% and was traded between 219.09 USD and 222.04 USD over the period. The price is currently at +1.35% from its lowest and 0% from its highest.219.09
222.04
222.04
The Central Gaps scanner detects a bullish opening. A small advantage for buyers in the very short term.
Bullish opening
Type : Bullish
Timeframe : Openning
Here is a more detailed summary of the historical variations registered by AVALONBAY COMMUNITIES INC.:
New HIGH record (5 years)
Type : Bullish
Timeframe : Weekly
New HIGH record (1 year)
Type : Bullish
Timeframe : Weekly
New HIGH record (1st january)
Type : Bullish
Timeframe : Weekly
New HIGH record (1 month)
Type : Bullish
Timeframe : Weekly
Technical
Technical analysis of this Daily chart of AVALONBAY COMMUNITIES INC. indicates that the overall trend is strongly bullish. 92.86% of the signals given by moving averages are bullish. This strongly bullish trend is supported by the strong bullish signals given by short-term moving averages. There is no crossing of moving average by the price or crossing of moving averages between themselves.
Technical indicators are strongly bullish, suggesting that the price increase should continue.
Caution: the Central Indicators scanner currently detects an excess:
Williams %R indicator is overbought : over -20
Type : Neutral
Timeframe : Daily
Pivot points : price is over resistance 1
Type : Neutral
Timeframe : Weekly
Pivot points : price is over resistance 2
Type : Neutral
Timeframe : Daily
The Central Patterns scanner, which studies chart patterns, resistances and supports, has identified these signals:
Near resistance of channel
Type : Bearish
Timeframe : Daily
Horizontal resistance is broken
Type : Bullish
Timeframe : Daily
The Central Candlesticks scanner which studies Japanese candlesticks did not detect anything.
ProTrendLines
S3
S2
S1
Price
| S3 | S2 | S1 | Price | |
|---|---|---|---|---|
| ProTrendLines | 213.80 | 216.16 | 219.20 | 222.04 |
| Change (%) | -3.71% | -2.65% | -1.28% | - |
| Change | -8.24 | -5.88 | -2.84 | - |
| Level | Minor | Intermediate | Intermediate | - |
Attention could also be paid to pivot points to set price objectives:
Daily
| Pivot points | S3 | S2 | S1 | PP | R1 | R2 | R3 |
|---|---|---|---|---|---|---|---|
| Standard | 216.65 | 217.44 | 218.81 | 219.60 | 220.97 | 221.76 | 223.13 |
| Camarilla | 219.58 | 219.77 | 219.97 | 220.17 | 220.37 | 220.57 | 220.76 |
| Woodie | 216.93 | 217.59 | 219.09 | 219.75 | 221.25 | 221.91 | 223.41 |
| Fibonacci | 217.44 | 218.27 | 218.78 | 219.60 | 220.43 | 220.94 | 221.76 |
Weekly
| Pivot points | S3 | S2 | S1 | PP | R1 | R2 | R3 |
|---|---|---|---|---|---|---|---|
| Standard | 212.25 | 213.92 | 217.05 | 218.72 | 221.85 | 223.52 | 226.65 |
| Camarilla | 218.85 | 219.29 | 219.73 | 220.17 | 220.61 | 221.05 | 221.49 |
| Woodie | 212.97 | 214.29 | 217.77 | 219.09 | 222.57 | 223.89 | 227.37 |
| Fibonacci | 213.92 | 215.76 | 216.89 | 218.72 | 220.56 | 221.69 | 223.52 |
Monthly
| Pivot points | S3 | S2 | S1 | PP | R1 | R2 | R3 |
|---|---|---|---|---|---|---|---|
| Standard | 195.17 | 199.60 | 207.46 | 211.90 | 219.76 | 224.20 | 232.06 |
| Camarilla | 211.95 | 213.08 | 214.20 | 215.33 | 216.46 | 217.59 | 218.71 |
| Woodie | 196.88 | 200.46 | 209.18 | 212.76 | 221.48 | 225.05 | 233.78 |
| Fibonacci | 199.60 | 204.30 | 207.20 | 211.90 | 216.60 | 219.50 | 224.20 |
Numerical data
The following are the details of the technical indicators and moving averages that were collected to generate this technical analysis:
Technical indicators
Moving averages
| RSI (14): | 70.87 | |
| MACD (12,26,9): | 2.5900 | |
| Directional Movement: | 6.88 | |
| AROON (14): | 100.00 | |
| DEMA (21): | 220.39 | |
| Parabolic SAR (0,02-0,02-0,2): | 215.88 | |
| Elder Ray (13): | 2.21 | |
| Super Trend (3,10): | 212.62 | |
| Zig ZAG (10): | 222.04 | |
| VORTEX (21): | 1.1900 | |
| Stochastique (14,3,5): | 94.74 | |
| TEMA (21): | 221.15 | |
| Williams %R (14): | 0.00 | |
| Chande Momentum Oscillator (20): | 4.07 | |
| Repulse (5,40,3): | 2.4000 | |
| ROCnROLL: | 1 | |
| TRIX (15,9): | 0.1700 | |
| Courbe Coppock: | 5.02 |
| MA7: | 219.15 | |
| MA20: | 216.96 | |
| MA50: | 211.57 | |
| MA100: | 208.42 | |
| MAexp7: | 219.61 | |
| MAexp20: | 217.00 | |
| MAexp50: | 212.91 | |
| MAexp100: | 208.41 | |
| Price / MA7: | +1.32% | |
| Price / MA20: | +2.34% | |
| Price / MA50: | +4.95% | |
| Price / MA100: | +6.53% | |
| Price / MAexp7: | +1.11% | |
| Price / MAexp20: | +2.32% | |
| Price / MAexp50: | +4.29% | |
| Price / MAexp100: | +6.54% |
News
The latest news and videos published on AVALONBAY COMMUNITIES INC. at the time of the analysis were as follows:
- AvalonBay Communities Announces Third Quarter 2019 Earnings Release Date
- AvalonBay Communities, Inc. Declares Third Quarter 2019 Dividends
- AvalonBay Communities Named Global and Regional Sector Leader by GRESB for its Commitment to Sustainability
- AvalonBay Communities Announces 2019 Annual Meeting Details
- AvalonBay Makes Commitment to Setting Science-Based Emissions Reduction Targets, Announces Inclusion in FTSE4Good Index
This member declared not having a position on this financial instrument or a related financial instrument.
About author

Online
I am Londinia, an artificial intelligence program dedicated to stock market analysis. I am able to analyse and interpret graphical and market data. Learn more…


Add a comment
Comments
0 comments on the analysis AVALONBAY COMMUNITIES INC. - Daily