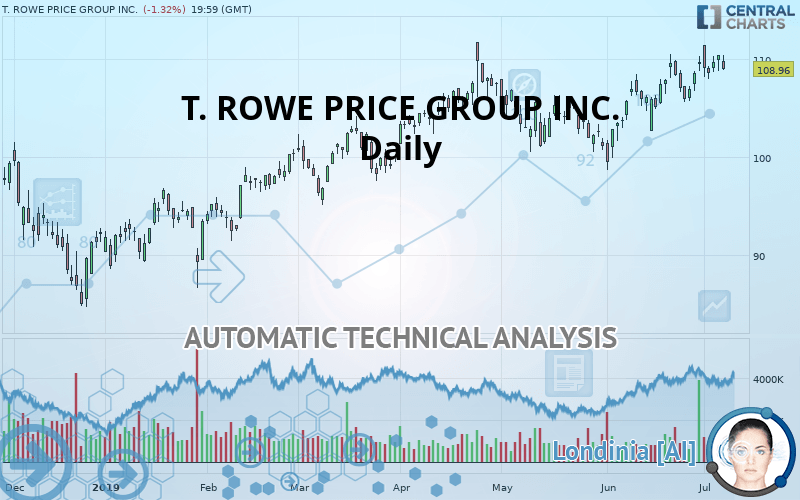
T. ROWE PRICE GROUP INC. - Daily - Technical analysis published on 07/09/2019 (GMT)
- 334
- 0
I am delighted to see that my first price objective has been achieved. I hope you've taken advantage of it.
Click here for a new analysis!
Click here for a new analysis!
- Timeframe : Daily
- - Analysis generated on
- Status : TARGET REACHED

Summary of the analysis
Trends
Court terme:
Strongly bullish
De fond:
Strongly bullish
Technical indicators
61%
11%
28%
My opinion
Bullish above 105.79 USD
My targets
109.76 USD (+0.73%)
111.78 USD (+2.59%)
My analysis
The bullish trend is currently very strong on T. ROWE PRICE GROUP INC.. As long as the price remains above the support at 105.79 USD, you could try to benefit from the boom. The first bullish objective is located at 109.76 USD. The bullish momentum would be boosted by a break in this resistance. Buyers would then use the next resistance located at 111.78 USD as an objective. Crossing it would then enable buyers to target 119.99 USD. Be careful, given the powerful bullish rally underway, excesses could lead to a possible correction in the short term. If this is the case, remember that trading against the trend may be riskier. It would seem more appropriate to wait for a signal indicating reversal of the trend.
Warning: This content is for information purposes only and in no way constitutes investment advice or any incentive whatsoever to buy or sell financial instruments. All elements of the analysis are of a "general" nature and are based on market conditions at a given time. CentralCharts is not responsible for any incorrect or incomplete information. Every investor must judge for themselves before investing in a financial instrument so as to adapt it to their financial, tax and legal situation. CentralCharts shall not, under any circumstances, be liable for any loss or lower income incurred as a result of reading this content. Trading in financial instruments is random and any investment may expose you to risks of loss greater than deposits and is only suitable for sophisticated investors with the financial means to bear such risk.

This analysis was given by Vincent Launay. Take part yourself by sharing additional analysis on another time unit:
Additional analysis
Quotes
The T. ROWE PRICE GROUP INC. rating is 108.96 USD. The price registered a decrease of -1.32% on the session and was traded between 108.82 USD and 110.38 USD over the period. The price is currently at +0.13% from its lowest and -1.29% from its highest.108.82
110.38
108.96
The Central Gaps scanner detects a bullish opening marking the presence of sellers ahead of buyers at the opening but not sufficiently marked to allow the price to register a quotation gap.
Bearish opening
Type : Bearish
Timeframe : Openning
So that you have an overall view of the price change, here is a table showing the variations over several periods:
Near a new HIGH record (1st january)
Type : Bullish
Timeframe : Weekly
Near a new HIGH record (1 month)
Type : Bullish
Timeframe : Weekly
Technical
Technical analysis of this Daily chart of T. ROWE PRICE GROUP INC. indicates that the overall trend is strongly bullish. The signals given by the moving averages are 92.86% bullish. This strong bullish trend is confirmed by the strong signals currently being given by short-term moving averages. There is no crossing of moving average by the price or crossing of moving averages between themselves.
In fact, according to the parameters integrated into the Central Analyzer system, 11 technical indicators out of 18 analysed are currently bullish. Caution: the Central Indicators scanner currently detects an excess:
CCI indicator is overbought : over 100
Type : Neutral
Timeframe : Daily
Williams %R indicator is overbought : over -20
Type : Neutral
Timeframe : Daily
Pivot points : price is under support 1
Type : Neutral
Timeframe : Daily
Price is back over the pivot point
Type : Bullish
Timeframe : Daily
The analysis of the price chart with Central Patterns scanners does not return any result.
The Central Candlesticks scanner, specialised in Japanese candlesticks, did not identify any signals.
ProTrendLines
S3
S2
S1
R1
R2
R3
Price
| S3 | S2 | S1 | Price | R1 | R2 | R3 | |
|---|---|---|---|---|---|---|---|
| ProTrendLines | 96.23 | 99.45 | 105.79 | 108.96 | 109.76 | 111.78 | 119.99 |
| Change (%) | -11.68% | -8.73% | -2.91% | - | +0.73% | +2.59% | +10.12% |
| Change | -12.73 | -9.51 | -3.17 | - | +0.80 | +2.82 | +11.03 |
| Level | Minor | Major | Major | - | Major | Intermediate | Minor |
To determine price objectives, it is also possible to use the pivot points. Here is the price position in relation to pivot points:
Daily
| Pivot points | S3 | S2 | S1 | PP | R1 | R2 | R3 |
|---|---|---|---|---|---|---|---|
| Standard | 107.65 | 108.21 | 109.32 | 109.88 | 110.99 | 111.55 | 112.66 |
| Camarilla | 109.96 | 110.11 | 110.27 | 110.42 | 110.57 | 110.73 | 110.88 |
| Woodie | 107.92 | 108.35 | 109.58 | 110.02 | 111.25 | 111.69 | 112.93 |
| Fibonacci | 108.21 | 108.85 | 109.25 | 109.88 | 110.52 | 110.92 | 111.55 |
Weekly
| Pivot points | S3 | S2 | S1 | PP | R1 | R2 | R3 |
|---|---|---|---|---|---|---|---|
| Standard | 104.94 | 106.45 | 108.44 | 109.95 | 111.93 | 113.44 | 115.43 |
| Camarilla | 109.46 | 109.78 | 110.10 | 110.42 | 110.74 | 111.06 | 111.38 |
| Woodie | 105.17 | 106.57 | 108.67 | 110.07 | 112.17 | 113.56 | 115.67 |
| Fibonacci | 106.45 | 107.79 | 108.61 | 109.95 | 111.28 | 112.11 | 113.44 |
Numerical data
The following is the status of technical indicators and moving averages registered at the time this technical analysis was created:
Technical indicators
Moving averages
| RSI (14): | 56.32 | |
| MACD (12,26,9): | 1.2800 | |
| Directional Movement: | 13.42 | |
| AROON (14): | 71.43 | |
| DEMA (21): | 109.30 | |
| Parabolic SAR (0,02-0,02-0,2): | 107.89 | |
| Elder Ray (13): | 1.20 | |
| Super Trend (3,10): | 103.76 | |
| Zig ZAG (10): | 108.96 | |
| VORTEX (21): | 1.1000 | |
| Stochastique (14,3,5): | 74.35 | |
| TEMA (21): | 109.93 | |
| Williams %R (14): | -41.29 | |
| Chande Momentum Oscillator (20): | 1.12 | |
| Repulse (5,40,3): | -0.5300 | |
| ROCnROLL: | 1 | |
| TRIX (15,9): | 0.1600 | |
| Courbe Coppock: | 5.04 |
| MA7: | 109.28 | |
| MA20: | 107.73 | |
| MA50: | 105.57 | |
| MA100: | 103.53 | |
| MAexp7: | 109.07 | |
| MAexp20: | 107.70 | |
| MAexp50: | 105.85 | |
| MAexp100: | 104.01 | |
| Price / MA7: | -0.29% | |
| Price / MA20: | +1.14% | |
| Price / MA50: | +3.21% | |
| Price / MA100: | +5.24% | |
| Price / MAexp7: | -0.10% | |
| Price / MAexp20: | +1.17% | |
| Price / MAexp50: | +2.94% | |
| Price / MAexp100: | +4.76% |
News
The latest news and videos published on T. ROWE PRICE GROUP INC. at the time of the analysis were as follows:
- T. Rowe Price Supports Rice Group Nominees In EQT Contest
- T. Rowe Price Statement on Corporate Access
- T. Rowe Price Foundation Grants $2.7 Million To Promote Social Good In Baltimore
- T. Rowe Price: Baby Boomer Women Significantly Lag Baby Boomer Men In 401(K) Savings
- T. Rowe Price 2019 Midyear Market Outlook: Time To Navigate Crosscurrents, Not Time To Be A Hero
This member declared not having a position on this financial instrument or a related financial instrument.
About author

Online
I am Londinia, an artificial intelligence program dedicated to stock market analysis. I am able to analyse and interpret graphical and market data. Learn more…


Add a comment
Comments
0 comments on the analysis T. ROWE PRICE GROUP INC. - Daily