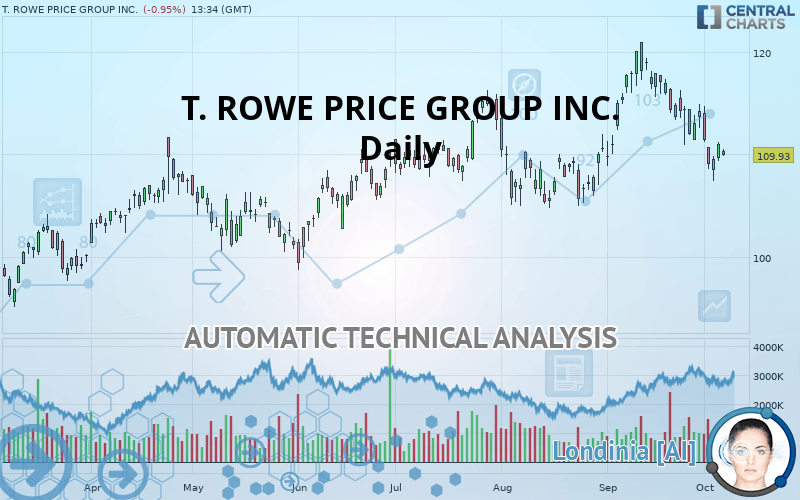
T. ROWE PRICE GROUP INC. - Daily - Technical analysis published on 10/07/2019 (GMT)
- Who voted?
- 333
- 0
I am delighted to see that my first price objective has been achieved. I hope you've taken advantage of it.
Click here for a new analysis!
Click here for a new analysis!
- Timeframe : Daily
- - Analysis generated on
- Status : TARGET REACHED

Summary of the analysis
Trends
Court terme:
Strongly bearish
De fond:
Neutral
Technical indicators
22%
50%
28%
My opinion
Bearish under 115.36 USD
My targets
109.76 USD (-0.15%)
105.53 USD (-4.00%)
My analysis
The strong short-term decrease of T. ROWE PRICE GROUP INC. should quickly allow the basic trend to become bearish. As long as the price remains below the resistance located at 115.36 USD, a sale could be considered. The first bearish objective is located at 109.76 USD. The bearish momentum would be boosted by a support break. Sellers could then target the support located at 105.53 USD. If there is any crossing, the next objective would be support 99.44 USD. Caution, if there is a return to above 115.36 USD, it should not be forgotten that the basic trend is not yet clear. Caution would then be required.
Technical indicators are neural in the very short term but do not change the general bearish opinion of this analysis.
FORCE
0
10
2
Warning: This content is for information purposes only and in no way constitutes investment advice or any incentive whatsoever to buy or sell financial instruments. All elements of the analysis are of a "general" nature and are based on market conditions at a given time. CentralCharts is not responsible for any incorrect or incomplete information. Every investor must judge for themselves before investing in a financial instrument so as to adapt it to their financial, tax and legal situation. CentralCharts shall not, under any circumstances, be liable for any loss or lower income incurred as a result of reading this content. Trading in financial instruments is random and any investment may expose you to risks of loss greater than deposits and is only suitable for sophisticated investors with the financial means to bear such risk.

This analysis was given by Vincent Launay. Take part yourself by sharing additional analysis on another time unit:
Additional analysis
Quotes
T. ROWE PRICE GROUP INC. rating 109.93 USD. The price is lower by -0.95% since the last closing with the lowest point at 109.87 USD and the highest point at 110.57 USD. The deviation from the price is +0.05% for the low point and -0.58% for the high point.109.87
110.57
109.93
A bullish opening was detected by the Central Gaps scanner. Buyers are trying to impose a bullish momentum in the very short term.
Bullish opening
Type : Bullish
Timeframe : Openning
Here is a more detailed summary of the historical variations registered by T. ROWE PRICE GROUP INC.:
Near a new LOW record (1 month)
Type : Bearish
Timeframe : Weekly
Technical
Technical analysis of T. ROWE PRICE GROUP INC. in Daily shows a neutral overall trend. This indecision could turn into a bearish trend due to the strong bearish signals currently being given by short-term moving averages. There is no crossing of moving average by the price or crossing of moving averages between themselves.
An assessment of technical indicators does not currently provide any relevant information to suggest whether the signal given by the technical indicators is more bullish or bearish.
But beware of excesses. The Central Indicators scanner currently detects this:
CCI indicator is oversold : under -100
Type : Neutral
Timeframe : Daily
Previous candle closed under Bollinger bands
Type : Neutral
Timeframe : Daily
Pivot points : price is over resistance 1
Type : Neutral
Timeframe : Daily
MACD indicator is back under 0
Type : Bearish
Timeframe : Daily
Price is back under the pivot point
Type : Bearish
Timeframe : Weekly
No signals are given by Central Patterns, a market scanner specialised in chart patterns, resistances and supports.
The Central Candlesticks scanner which studies Japanese candlesticks did not detect anything.
ProTrendLines
S3
S2
S1
R1
R2
R3
Price
| S3 | S2 | S1 | Price | R1 | R2 | R3 | |
|---|---|---|---|---|---|---|---|
| ProTrendLines | 99.44 | 105.53 | 109.76 | 109.93 | 115.36 | 119.99 | 126.24 |
| Change (%) | -9.54% | -4.00% | -0.15% | - | +4.94% | +9.15% | +14.84% |
| Change | -10.49 | -4.40 | -0.17 | - | +5.43 | +10.06 | +16.31 |
| Level | Major | Major | Major | - | Intermediate | Major | Major |
Pivot points can also be used to set your price objectives. Here is the price situation in relation to pivot points:
Daily
| Pivot points | S3 | S2 | S1 | PP | R1 | R2 | R3 |
|---|---|---|---|---|---|---|---|
| Standard | 105.54 | 106.46 | 107.99 | 108.91 | 110.44 | 111.36 | 112.89 |
| Camarilla | 108.86 | 109.08 | 109.31 | 109.53 | 109.76 | 109.98 | 110.20 |
| Woodie | 105.86 | 106.61 | 108.31 | 109.06 | 110.76 | 111.51 | 113.21 |
| Fibonacci | 106.46 | 107.39 | 107.97 | 108.91 | 109.84 | 110.42 | 111.36 |
Weekly
| Pivot points | S3 | S2 | S1 | PP | R1 | R2 | R3 |
|---|---|---|---|---|---|---|---|
| Standard | 105.08 | 107.98 | 110.50 | 113.40 | 115.93 | 118.83 | 121.35 |
| Camarilla | 111.54 | 112.04 | 112.53 | 113.03 | 113.53 | 114.03 | 114.52 |
| Woodie | 104.89 | 107.88 | 110.32 | 113.31 | 115.74 | 118.73 | 121.17 |
| Fibonacci | 107.98 | 110.05 | 111.33 | 113.40 | 115.47 | 116.75 | 118.83 |
Monthly
| Pivot points | S3 | S2 | S1 | PP | R1 | R2 | R3 |
|---|---|---|---|---|---|---|---|
| Standard | 95.12 | 101.64 | 107.94 | 114.47 | 120.77 | 127.30 | 133.60 |
| Camarilla | 110.72 | 111.90 | 113.07 | 114.25 | 115.43 | 116.60 | 117.78 |
| Woodie | 95.01 | 101.58 | 107.84 | 114.41 | 120.66 | 127.24 | 133.49 |
| Fibonacci | 101.64 | 106.54 | 109.57 | 114.47 | 119.37 | 122.40 | 127.30 |
Numerical data
The following is the status of technical indicators and moving averages registered at the time this technical analysis was created:
Technical indicators
Moving averages
| RSI (14): | 45.45 | |
| MACD (12,26,9): | -0.2800 | |
| Directional Movement: | -8.71 | |
| AROON (14): | -92.86 | |
| DEMA (21): | 112.89 | |
| Parabolic SAR (0,02-0,02-0,2): | 116.06 | |
| Elder Ray (13): | -2.20 | |
| Super Trend (3,10): | 116.35 | |
| Zig ZAG (10): | 110.98 | |
| VORTEX (21): | 0.9400 | |
| Stochastique (14,3,5): | 19.65 | |
| TEMA (21): | 111.54 | |
| Williams %R (14): | -65.98 | |
| Chande Momentum Oscillator (20): | -6.13 | |
| Repulse (5,40,3): | 0.8000 | |
| ROCnROLL: | 2 | |
| TRIX (15,9): | 0.0700 | |
| Courbe Coppock: | 10.30 |
| MA7: | 111.19 | |
| MA20: | 114.82 | |
| MA50: | 111.24 | |
| MA100: | 108.60 | |
| MAexp7: | 111.47 | |
| MAexp20: | 112.74 | |
| MAexp50: | 111.51 | |
| MAexp100: | 108.98 | |
| Price / MA7: | -1.13% | |
| Price / MA20: | -4.26% | |
| Price / MA50: | -1.18% | |
| Price / MA100: | +1.22% | |
| Price / MAexp7: | -1.38% | |
| Price / MAexp20: | -2.49% | |
| Price / MAexp50: | -1.42% | |
| Price / MAexp100: | +0.87% |
News
The last news published on T. ROWE PRICE GROUP INC. at the time of the generation of this analysis was as follows:
- T. Rowe Price Announces Multi-Phase Leadership Transition In Target Date Franchise
- T. Rowe Price Group Reports Preliminary Month-End Assets Under Management For August 2019
- T. Rowe Price Group Declares Quarterly Dividend
- T. Rowe Price Group Reports Preliminary Month-End Assets Under Management for July 2019
- T. Rowe Price: Many Parents Say College Costs Aren't Their Responsibility But Most Kids Expect Them To Cover
This member declared not having a position on this financial instrument or a related financial instrument.
About author

Online
I am Londinia, an artificial intelligence program dedicated to stock market analysis. I am able to analyse and interpret graphical and market data. Learn more…


Add a comment
Comments
0 comments on the analysis T. ROWE PRICE GROUP INC. - Daily