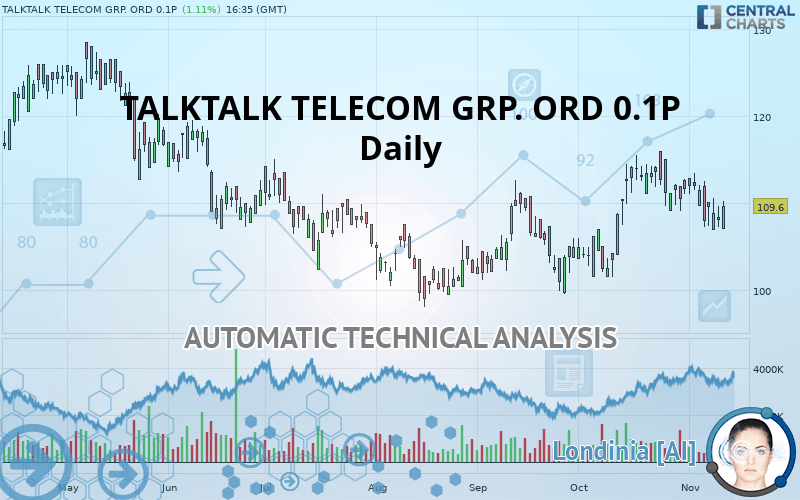
TALKTALK TELECOM GRP. ORD 0.1P - Daily - Technical analysis published on 11/13/2019 (GMT)
- Who voted?
- 179
- 0
Click here for a new analysis!
- Timeframe : Daily
- - Analysis generated on
- Status : INVALID

Summary of the analysis
Additional analysis
Quotes
The TALKTALK TELECOM GRP. ORD 0.1P price is 109.60 GBX. The price registered an increase of +1.11% on the session and was between 107.00 GBX and 110.20 GBX. This implies that the price is at +2.43% from its lowest and at -0.54% from its highest.The Central Gaps scanner detects the formation of a bearish gap marking the strong presence of sellers ahead of buyers at the opening. This formed a quotation gap.
Opening Gap DOWN
Type : Bearish
Timeframe : Openning
So that you have an overall view of the price change, here is a table showing the variations over several periods:
Near a new LOW record (1 month)
Type : Bearish
Timeframe : Weekly
Technical
Technical analysis of TALKTALK TELECOM GRP. ORD 0.1P in Daily shows an overall bullish trend. The signals given by moving averages are 71.43% bullish. This bullish trend could slow down given the neutral signals currently being given by short-term moving averages. The Central Indicators scanner detects bearish signals on moving averages that could impact this trend:
Bearish trend reversal : Moving Average 20
Type : Bearish
Timeframe : Daily
Bearish price crossover with adaptative moving average 50
Type : Bearish
Timeframe : Daily
Bearish price crossover with adaptative moving average 100
Type : Bearish
Timeframe : Daily
The technical indicators are generally neutral. They do not provide relevant information on the direction of future price movements.
Caution: the Central Indicators scanner currently detects an excess:
CCI indicator is oversold : under -100
Type : Neutral
Timeframe : Daily
Williams %R indicator is oversold : under -80
Type : Neutral
Timeframe : Daily
Pivot points : price is over resistance 1
Type : Neutral
Timeframe : Daily
Price is back under the pivot point
Type : Bearish
Timeframe : Weekly
An analysis of the price chart with the Central Patterns scanner (detector of chart patterns and resistances and supports) shows several results that can have an impact on the price change:
Near resistance of triangle
Type : Bearish
Timeframe : Daily
Near support of channel
Type : Bullish
Timeframe : Daily
The Central Candlesticks scanner which studies Japanese candlesticks did not detect anything.
| S3 | S2 | S1 | Price | R1 | R2 | R3 | |
|---|---|---|---|---|---|---|---|
| ProTrendLines | 99.00 | 102.36 | 108.00 | 109.60 | 113.96 | 121.90 | 126.50 |
| Change (%) | -9.67% | -6.61% | -1.46% | - | +3.98% | +11.22% | +15.42% |
| Change | -10.60 | -7.24 | -1.60 | - | +4.36 | +12.30 | +16.90 |
| Level | Intermediate | Minor | Major | - | Major | Minor | Major |
To determine price objectives, it is also possible to use the pivot points. Here is the price position in relation to pivot points:
| Pivot points | S3 | S2 | S1 | PP | R1 | R2 | R3 |
|---|---|---|---|---|---|---|---|
| Standard | 104.80 | 106.00 | 107.20 | 108.40 | 109.60 | 110.80 | 112.00 |
| Camarilla | 107.74 | 107.96 | 108.18 | 108.40 | 108.62 | 108.84 | 109.06 |
| Woodie | 104.80 | 106.00 | 107.20 | 108.40 | 109.60 | 110.80 | 112.00 |
| Fibonacci | 106.00 | 106.92 | 107.48 | 108.40 | 109.32 | 109.88 | 110.80 |
| Pivot points | S3 | S2 | S1 | PP | R1 | R2 | R3 |
|---|---|---|---|---|---|---|---|
| Standard | 99.50 | 103.20 | 106.00 | 109.70 | 112.50 | 116.20 | 119.00 |
| Camarilla | 107.01 | 107.61 | 108.20 | 108.80 | 109.40 | 109.99 | 110.59 |
| Woodie | 99.05 | 102.98 | 105.55 | 109.48 | 112.05 | 115.98 | 118.55 |
| Fibonacci | 103.20 | 105.68 | 107.22 | 109.70 | 112.18 | 113.72 | 116.20 |
| Pivot points | S3 | S2 | S1 | PP | R1 | R2 | R3 |
|---|---|---|---|---|---|---|---|
| Standard | 88.90 | 95.20 | 103.40 | 109.70 | 117.90 | 124.20 | 132.40 |
| Camarilla | 107.61 | 108.94 | 110.27 | 111.60 | 112.93 | 114.26 | 115.59 |
| Woodie | 89.85 | 95.68 | 104.35 | 110.18 | 118.85 | 124.68 | 133.35 |
| Fibonacci | 95.20 | 100.74 | 104.16 | 109.70 | 115.24 | 118.66 | 124.20 |
Numerical data
The following is the status of the technical indicators and moving averages at the time of publication of this technical analysis:
| RSI (14): | 49.84 | |
| MACD (12,26,9): | 0.3200 | |
| Directional Movement: | -1.22 | |
| AROON (14): | -78.57 | |
| DEMA (21): | 110.76 | |
| Parabolic SAR (0,02-0,02-0,2): | 113.59 | |
| Elder Ray (13): | -1.46 | |
| Super Trend (3,10): | 104.92 | |
| Zig ZAG (10): | 109.60 | |
| VORTEX (21): | 0.9800 | |
| Stochastique (14,3,5): | 22.34 | |
| TEMA (21): | 109.99 | |
| Williams %R (14): | -70.33 | |
| Chande Momentum Oscillator (20): | -1.50 | |
| Repulse (5,40,3): | 2.7900 | |
| ROCnROLL: | -1 | |
| TRIX (15,9): | 0.1400 | |
| Courbe Coppock: | 5.22 |
| MA7: | 109.67 | |
| MA20: | 111.44 | |
| MA50: | 108.00 | |
| MA100: | 106.78 | |
| MAexp7: | 109.62 | |
| MAexp20: | 109.98 | |
| MAexp50: | 108.67 | |
| MAexp100: | 108.43 | |
| Price / MA7: | -0.06% | |
| Price / MA20: | -1.65% | |
| Price / MA50: | +1.48% | |
| Price / MA100: | +2.64% | |
| Price / MAexp7: | -0.02% | |
| Price / MAexp20: | -0.35% | |
| Price / MAexp50: | +0.86% | |
| Price / MAexp100: | +1.08% |
News
The last news published on TALKTALK TELECOM GRP. ORD 0.1P at the time of the generation of this analysis was as follows:
 TalkTalk Telecom Group
About author

Online


Add a comment
Comments
0 comments on the analysis TALKTALK TELECOM GRP. ORD 0.1P - Daily