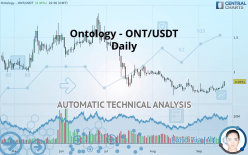
ONTOLOGY - ONT/USDT - Daily - Technical analysis published on 09/18/2019 (GMT)
- 359
- 0
Click here for a new analysis!
- Timeframe : Daily
- - Analysis generated on
- Status : INVALID

Summary of the analysis

Additional analysis
Quotes
The Ontology - ONT/USDT rating is 0.855100 USDT. The price has increased by +8.35% since the last closing with the lowest point at 0.788200 USDT and the highest point at 0.859600 USDT. The deviation from the price is +8.49% for the low point and -0.52% for the high point.The Central Gaps scanner detects a bearish opening. A small advantage for sellers in the very short term.
Bearish opening
Type : Bearish
Timeframe : Openning
Here is a more detailed summary of the historical variations registered by Ontology - ONT/USDT:
Near a new HIGH record (1 month)
Type : Bullish
Timeframe : Weekly
Technical
Technical analysis of Ontology - ONT/USDT in Daily shows an overall slightly bearish trend. 57.14% of the signals given by moving averages are bearish. Caution: the strong bullish signals currently being given by short-term moving averages could quickly lead to a reversal of the trend. The Central Indicators scanner does not detect any result on moving averages that would impact this trend.
The probability of a further increase is high given the direction of the technical indicators.
But beware of excesses. The Central Indicators scanner currently detects this:
CCI indicator is overbought : over 100
Type : Neutral
Timeframe : Daily
Williams %R indicator is overbought : over -20
Type : Neutral
Timeframe : Daily
Pivot points : price is over resistance 1
Type : Neutral
Timeframe : Daily
Pivot points : price is over resistance 1
Type : Neutral
Timeframe : Weekly
Aroon indicator bullish trend
Type : Bullish
Timeframe : Daily
SuperTrend indicator bullish reversal
Type : Bullish
Timeframe : Daily
The Central Patterns scanner, which studies chart patterns, resistances and supports, has identified these signals:
Horizontal resistance is broken
Type : Bullish
Timeframe : Daily
Resistance of channel is broken
Type : Bullish
Timeframe : Daily
The presence of a bullish Japanese candlestick pattern detected by Central Candlesticks that could cause a very short term rebound was also detected:
Bullish engulfing lines
Type : Bullish
Timeframe : Daily
| S2 | S1 | Price | R1 | R2 | R3 | |
|---|---|---|---|---|---|---|
| ProTrendLines | 0.689600 | 0.794267 | 0.855100 | 1.023770 | 1.314440 | 1.777000 |
| Change (%) | -19.35% | -7.11% | - | +19.73% | +53.72% | +107.81% |
| Change | -0.165500 | -0.060833 | - | +0.168670 | +0.459340 | +0.921900 |
| Level | Intermediate | Intermediate | - | Intermediate | Intermediate | Intermediate |
Pivot points can also be used to set your price objectives. Here is the price situation in relation to pivot points:
| Pivot points | S3 | S2 | S1 | PP | R1 | R2 | R3 |
|---|---|---|---|---|---|---|---|
| Standard | 0.692500 | 0.725200 | 0.757200 | 0.789900 | 0.821900 | 0.854600 | 0.886600 |
| Camarilla | 0.771408 | 0.777338 | 0.783269 | 0.789200 | 0.795131 | 0.801062 | 0.806993 |
| Woodie | 0.692150 | 0.725025 | 0.756850 | 0.789725 | 0.821550 | 0.854425 | 0.886250 |
| Fibonacci | 0.725200 | 0.749915 | 0.765185 | 0.789900 | 0.814615 | 0.829885 | 0.854600 |
| Pivot points | S3 | S2 | S1 | PP | R1 | R2 | R3 |
|---|---|---|---|---|---|---|---|
| Standard | 0.602400 | 0.651100 | 0.704200 | 0.752900 | 0.806000 | 0.854700 | 0.907800 |
| Camarilla | 0.729305 | 0.738637 | 0.747968 | 0.757300 | 0.766632 | 0.775963 | 0.785295 |
| Woodie | 0.604600 | 0.652200 | 0.706400 | 0.754000 | 0.808200 | 0.855800 | 0.910000 |
| Fibonacci | 0.651100 | 0.689988 | 0.714012 | 0.752900 | 0.791788 | 0.815812 | 0.854700 |
| Pivot points | S3 | S2 | S1 | PP | R1 | R2 | R3 |
|---|---|---|---|---|---|---|---|
| Standard | 0.628933 | 0.605567 | 0.681333 | 0.657967 | 0.733733 | 0.710367 | 0.786133 |
| Camarilla | 0.742690 | 0.747493 | 0.752297 | 0.757100 | 0.761903 | 0.766707 | 0.771510 |
| Woodie | 0.678500 | 0.630350 | 0.730900 | 0.682750 | 0.783300 | 0.735150 | 0.835700 |
| Fibonacci | 0.605567 | 0.625584 | 0.637950 | 0.657967 | 0.677984 | 0.690350 | 0.710367 |
Numerical data
The following are the details of the technical indicators and moving averages that were collected to generate this technical analysis:
| RSI (14): | 58.58 | |
| MACD (12,26,9): | -0.0062 | |
| Directional Movement: | 9.591137 | |
| AROON (14): | 21.428574 | |
| DEMA (21): | 0.735752 | |
| Parabolic SAR (0,02-0,02-0,2): | 0.591816 | |
| Elder Ray (13): | 0.070738 | |
| Super Trend (3,10): | 0.614874 | |
| Zig ZAG (10): | 0.847100 | |
| VORTEX (21): | 1.0356 | |
| Stochastique (14,3,5): | 88.15 | |
| TEMA (21): | 0.769292 | |
| Williams %R (14): | -4.51 | |
| Chande Momentum Oscillator (20): | 0.136300 | |
| Repulse (5,40,3): | 7.7992 | |
| ROCnROLL: | -1 | |
| TRIX (15,9): | -0.3813 | |
| Courbe Coppock: | 10.97 |
| MA7: | 0.751014 | |
| MA20: | 0.734930 | |
| MA50: | 0.797884 | |
| MA100: | 1.027906 | |
| MAexp7: | 0.766424 | |
| MAexp20: | 0.753152 | |
| MAexp50: | 0.820321 | |
| MAexp100: | 0.935138 | |
| Price / MA7: | +13.86% | |
| Price / MA20: | +16.35% | |
| Price / MA50: | +7.17% | |
| Price / MA100: | -16.81% | |
| Price / MAexp7: | +11.57% | |
| Price / MAexp20: | +13.54% | |
| Price / MAexp50: | +4.24% | |
| Price / MAexp100: | -8.56% |
About author

Online


Add a comment
Comments
0 comments on the analysis ONTOLOGY - ONT/USDT - Daily