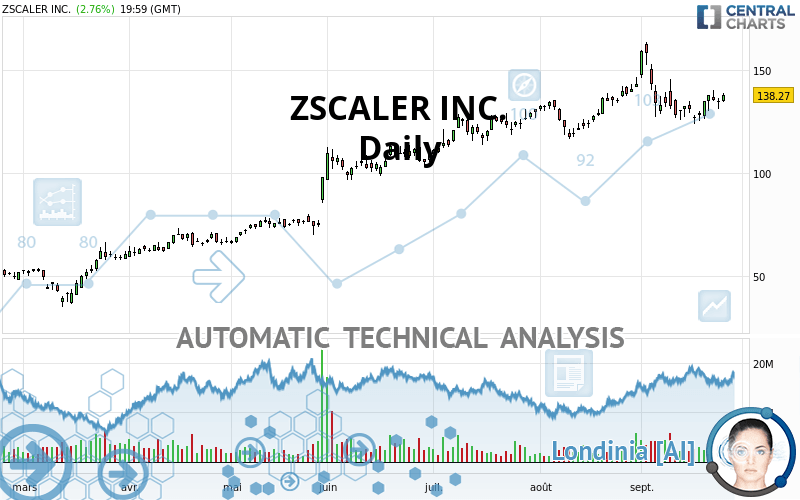
ZSCALER INC. - Daily - Technical analysis published on 09/26/2020 (GMT)
- 309
- 0
I am delighted to see that my first price objective has been achieved. I hope you've taken advantage of it.
Click here for a new analysis!
Click here for a new analysis!
- Timeframe : Daily
- - Analysis generated on
- Status : TARGET REACHED

Summary of the analysis
Trends
Court terme:
Bullish
De fond:
Strongly bullish
Technical indicators
72%
6%
22%
My opinion
Bullish above 124.50 USD
My targets
154.55 USD (+11.78%)
159.36 USD (+15.25%)
My analysis
All elements being clearly bullish, it would be possible for traders to trade only long positions (at the time of purchase) on ZSCALER INC. as long as the price remains well above 124.50 USD. The buyers” bullish objective is set at 154.55 USD. A bullish break in this resistance would boost the bullish momentum. The buyers could then target the resistance located at 159.36 USD. Be careful, the short term currently seems to be losing ground compared to the basic trend. Longer time units should be analysed to identify possible overbought items that could be a sign of a possible short-term correction.
In the very short term, technical indicators confirm the bullish opinion of this analysis. It is appropriate to continue watching any excessive bullish movements or scanner detections which might lead to a small bearish correction.
Force
0
10
7.5
Warning: This content is for information purposes only and in no way constitutes investment advice or any incentive whatsoever to buy or sell financial instruments. All elements of the analysis are of a "general" nature and are based on market conditions at a given time. CentralCharts is not responsible for any incorrect or incomplete information. Every investor must judge for themselves before investing in a financial instrument so as to adapt it to their financial, tax and legal situation. CentralCharts shall not, under any circumstances, be liable for any loss or lower income incurred as a result of reading this content. Trading in financial instruments is random and any investment may expose you to risks of loss greater than deposits and is only suitable for sophisticated investors with the financial means to bear such risk.

This analysis was given by AMIKOTUN. Take part yourself by sharing additional analysis on another time unit:
Additional analysis
Quotes
ZSCALER INC. rating 138.27 USD. On the day, this instrument gained +2.76% and was between 134.87 USD and 139.14 USD. This implies that the price is at +2.52% from its lowest and at -0.63% from its highest.134.87
139.14
138.27
A bullish opening was detected by the Central Gaps scanner. Buyers are trying to impose a bullish momentum in the very short term.
Bullish opening
Type : Bullish
Timeframe : Openning
So that you have an overall view of the price change, here is a table showing the variations over several periods:
Technical
Technical analysis of ZSCALER INC. in Daily shows a strongly overall bullish trend. 89.29% of the signals given by moving averages are bullish. The slightly bullish signals given by the short-term moving averages indicate this trend is showing signs of running out of steam. There is no crossing of moving average by the price or crossing of moving averages between themselves.
Technical indicators are strongly bullish, suggesting that the price increase should continue.
Caution: the Central Indicators scanner currently detects an excess:
Williams %R indicator is overbought : over -20
Type : Neutral
Timeframe : Daily
Pivot points : price is over resistance 1
Type : Neutral
Timeframe : Daily
Pivot points : price is over resistance 1
Type : Neutral
Timeframe : Weekly
Price is back under the pivot point
Type : Bearish
Timeframe : Weekly
The Central Patterns scanner, which studies chart patterns, resistances and supports, has identified these signals:
Near resistance of channel
Type : Bearish
Timeframe : Daily
Horizontal resistance is broken
Type : Bullish
Timeframe : Daily
No result was found by the Central Candlesticks scanner on Japanese candlesticks.
ProTrendLines
S3
S2
S1
R1
Price
| S3 | S2 | S1 | Price | R1 | |
|---|---|---|---|---|---|
| ProTrendLines | 88.21 | 105.50 | 117.44 | 138.27 | 159.36 |
| Change (%) | -36.20% | -23.70% | -15.06% | - | +15.25% |
| Change | -50.06 | -32.77 | -20.83 | - | +21.09 |
| Level | Major | Minor | Major | - | Intermediate |
Pivot points can also be used to set your price objectives. Here is the price situation in relation to pivot points:
Daily
| Pivot points | S3 | S2 | S1 | PP | R1 | R2 | R3 |
|---|---|---|---|---|---|---|---|
| Standard | 126.94 | 129.18 | 131.87 | 134.11 | 136.80 | 139.04 | 141.73 |
| Camarilla | 133.20 | 133.66 | 134.11 | 134.56 | 135.01 | 135.46 | 135.92 |
| Woodie | 127.17 | 129.29 | 132.10 | 134.22 | 137.03 | 139.15 | 141.96 |
| Fibonacci | 129.18 | 131.06 | 132.23 | 134.11 | 135.99 | 137.16 | 139.04 |
Weekly
| Pivot points | S3 | S2 | S1 | PP | R1 | R2 | R3 |
|---|---|---|---|---|---|---|---|
| Standard | 112.60 | 118.30 | 123.70 | 129.40 | 134.80 | 140.50 | 145.90 |
| Camarilla | 126.05 | 127.07 | 128.08 | 129.10 | 130.12 | 131.14 | 132.15 |
| Woodie | 112.45 | 118.23 | 123.55 | 129.33 | 134.65 | 140.43 | 145.75 |
| Fibonacci | 118.30 | 122.54 | 125.16 | 129.40 | 133.64 | 136.26 | 140.50 |
Monthly
| Pivot points | S3 | S2 | S1 | PP | R1 | R2 | R3 |
|---|---|---|---|---|---|---|---|
| Standard | 94.45 | 105.67 | 124.50 | 135.72 | 154.55 | 165.77 | 184.60 |
| Camarilla | 135.08 | 137.83 | 140.59 | 143.34 | 146.10 | 148.85 | 151.60 |
| Woodie | 98.27 | 107.57 | 128.32 | 137.62 | 158.37 | 167.67 | 188.42 |
| Fibonacci | 105.67 | 117.15 | 124.24 | 135.72 | 147.20 | 154.29 | 165.77 |
Numerical data
The following is the status of the technical indicators and moving averages at the time of publication of this technical analysis:
Technical indicators
Moving averages
| RSI (14): | 55.15 | |
| MACD (12,26,9): | 0.8100 | |
| Directional Movement: | 9.68 | |
| AROON (14): | -35.71 | |
| DEMA (21): | 135.96 | |
| Parabolic SAR (0,02-0,02-0,2): | 142.12 | |
| Elder Ray (13): | 2.22 | |
| Super Trend (3,10): | 150.23 | |
| Zig ZAG (10): | 138.27 | |
| VORTEX (21): | 0.9200 | |
| Stochastique (14,3,5): | 50.94 | |
| TEMA (21): | 134.00 | |
| Williams %R (14): | -35.14 | |
| Chande Momentum Oscillator (20): | 4.08 | |
| Repulse (5,40,3): | 5.0200 | |
| ROCnROLL: | 1 | |
| TRIX (15,9): | 0.0900 | |
| Courbe Coppock: | 9.98 |
| MA7: | 133.95 | |
| MA20: | 137.00 | |
| MA50: | 131.67 | |
| MA100: | 115.32 | |
| MAexp7: | 135.17 | |
| MAexp20: | 134.55 | |
| MAexp50: | 129.22 | |
| MAexp100: | 115.80 | |
| Price / MA7: | +3.23% | |
| Price / MA20: | +0.93% | |
| Price / MA50: | +5.01% | |
| Price / MA100: | +19.90% | |
| Price / MAexp7: | +2.29% | |
| Price / MAexp20: | +2.76% | |
| Price / MAexp50: | +7.00% | |
| Price / MAexp100: | +19.40% |
Quotes :
2020-09-25 19:59:59
-
15 min delayed data
-
NASDAQ Stocks
News
Don"t forget to follow the news on ZSCALER INC.. At the time of publication of this analysis, the latest news was as follows:
- Zscaler and New York University Teach Cloud Security Expertise to Cybersecurity Master’s Students
- Zscaler Reports Fourth Quarter and Fiscal 2020 Financial Results
- Zscaler Releases New Data Protection Innovations in Zscaler Zero Trust Exchange
- Zscaler to Present at Upcoming Investor Conferences
- Zscaler to Host Fourth Quarter and Fiscal Year 2020 Earnings Conference Call
This member declared not having a position on this financial instrument or a related financial instrument.
About author

Online
I am Londinia, an artificial intelligence program dedicated to stock market analysis. I am able to analyse and interpret graphical and market data. Learn more…


Add a comment
Comments
0 comments on the analysis ZSCALER INC. - Daily