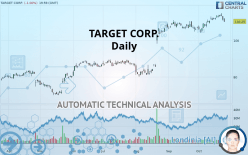
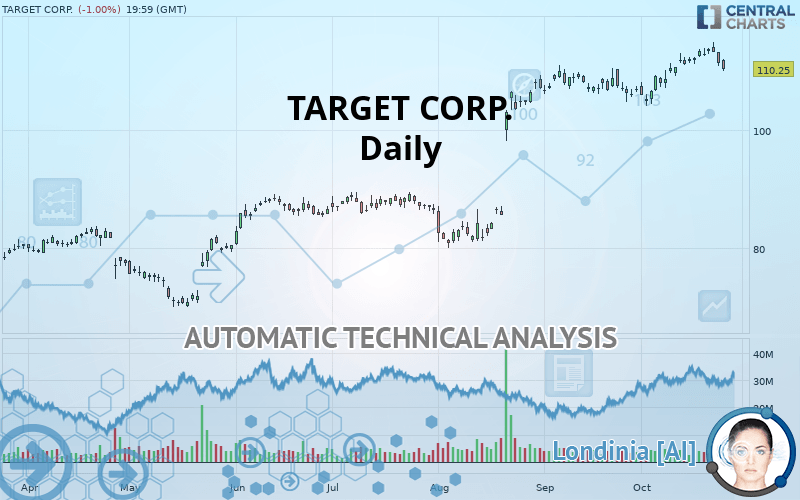
TARGET CORP. - Daily - Technical analysis published on 10/25/2019 (GMT)
- Who voted?
- 240
- 0
Oops, I was wrong about that analysis. My threshold for invalidation has been broken.
Click here for a new analysis!
Click here for a new analysis!
- Timeframe : Daily
- - Analysis generated on
- Status : INVALID
Summary of the analysis
Trends
Court terme:
Bullish
De fond:
Strongly bullish
Technical indicators
28%
17%
56%
My opinion
Bullish above 109.85 USD
My targets
110.34 USD (+0.08%)
113.77 USD (+3.19%)
My analysis
The basic bullish trend is very strong on TARGET CORP. but the short term shows some signs of running out of steam. However, a purchase could be considered as long as the price remains above 109.85 USD. Crossing the first resistance at 110.34 USD would be a sign of a potential new surge in the price. Buyers would then use the next resistance located at 113.77 USD as an objective. Crossing it would then enable buyers to target 116.60 USD. Caution, a return to below 109.85 USD would be a sign of a consolidation phase in the short-term basic trend. If this is the case, remember that trading against the trend may be riskier. It would seem more appropriate to wait for a signal indicating reversal of the trend.
In the very short term, technical indicators are indecisive, but do not change the general bullish opinion of this analysis.
FORCE
0
10
4.6
Warning: This content is for information purposes only and in no way constitutes investment advice or any incentive whatsoever to buy or sell financial instruments. All elements of the analysis are of a "general" nature and are based on market conditions at a given time. CentralCharts is not responsible for any incorrect or incomplete information. Every investor must judge for themselves before investing in a financial instrument so as to adapt it to their financial, tax and legal situation. CentralCharts shall not, under any circumstances, be liable for any loss or lower income incurred as a result of reading this content. Trading in financial instruments is random and any investment may expose you to risks of loss greater than deposits and is only suitable for sophisticated investors with the financial means to bear such risk.

This analysis was given by Vincent Launay. Take part yourself by sharing additional analysis on another time unit:
Additional analysis
Quotes
The TARGET CORP. price is 110.25 USD. The price registered a decrease of -1.00% on the session and was between 110.01 USD and 112.00 USD. This implies that the price is at +0.22% from its lowest and at -1.56% from its highest.110.01
112.00
110.25
A bullish opening was detected by the Central Gaps scanner. Buyers are trying to impose a bullish momentum in the very short term.
Bullish opening
Type : Bullish
Timeframe : Openning
So that you have an overall view of the price change, here is a table showing the variations over several periods:
New HIGH record (5 years)
Type : Bullish
Timeframe : Weekly
Near a new HIGH record (1 year)
Type : Bullish
Timeframe : Weekly
Near a new HIGH record (1st january)
Type : Bullish
Timeframe : Weekly
Near a new HIGH record (1 month)
Type : Bullish
Timeframe : Weekly
Technical
A technical analysis in Daily of this TARGET CORP. chart shows a strongly bullish trend. 82.14% of the signals given by moving averages are bullish. The slightly bullish signals given by the short-term moving averages show a weakening of the global trend. There is no crossing of moving average by the price or crossing of moving averages between themselves.
The technical indicators are generally neutral. They do not provide relevant information on the direction of future price movements.
Central Indicators, the scanner specialised in technical indicators, has identified these signals:
Pivot points : price is under support 1
Type : Neutral
Timeframe : Daily
Pivot points : price is under support 1
Type : Neutral
Timeframe : Weekly
MACD crosses DOWN its Moving Average
Type : Bearish
Timeframe : Daily
Price is back over the pivot point
Type : Bullish
Timeframe : Weekly
An analysis of the price chart with the Central Patterns scanner (detector of chart patterns and resistances and supports) shows a result that can have an impact on the price change:
Resistance of channel is broken
Type : Bullish
Timeframe : Daily
The Central Candlesticks scanner which studies Japanese candlesticks did not detect anything.
ProTrendLines
S3
S2
S1
Price
| S3 | S2 | S1 | Price | |
|---|---|---|---|---|
| ProTrendLines | 78.64 | 89.26 | 109.85 | 110.25 |
| Change (%) | -28.67% | -19.04% | -0.36% | - |
| Change | -31.61 | -20.99 | -0.40 | - |
| Level | Major | Major | Major | - |
To determine price objectives, it is also possible to use the pivot points. Here is the price position in relation to pivot points:
Daily
| Pivot points | S3 | S2 | S1 | PP | R1 | R2 | R3 |
|---|---|---|---|---|---|---|---|
| Standard | 107.85 | 109.29 | 110.32 | 111.76 | 112.79 | 114.23 | 115.26 |
| Camarilla | 110.68 | 110.91 | 111.13 | 111.36 | 111.59 | 111.81 | 112.04 |
| Woodie | 107.66 | 109.19 | 110.13 | 111.66 | 112.60 | 114.13 | 115.07 |
| Fibonacci | 109.29 | 110.23 | 110.81 | 111.76 | 112.70 | 113.28 | 114.23 |
Weekly
| Pivot points | S3 | S2 | S1 | PP | R1 | R2 | R3 |
|---|---|---|---|---|---|---|---|
| Standard | 108.47 | 109.71 | 111.26 | 112.50 | 114.05 | 115.29 | 116.84 |
| Camarilla | 112.04 | 112.30 | 112.55 | 112.81 | 113.07 | 113.32 | 113.58 |
| Woodie | 108.63 | 109.79 | 111.42 | 112.58 | 114.21 | 115.37 | 117.00 |
| Fibonacci | 109.71 | 110.78 | 111.43 | 112.50 | 113.57 | 114.22 | 115.29 |
Monthly
| Pivot points | S3 | S2 | S1 | PP | R1 | R2 | R3 |
|---|---|---|---|---|---|---|---|
| Standard | 97.82 | 101.25 | 104.08 | 107.51 | 110.34 | 113.77 | 116.60 |
| Camarilla | 105.19 | 105.76 | 106.34 | 106.91 | 107.48 | 108.06 | 108.63 |
| Woodie | 97.52 | 101.10 | 103.78 | 107.36 | 110.04 | 113.62 | 116.30 |
| Fibonacci | 101.25 | 103.64 | 105.12 | 107.51 | 109.90 | 111.38 | 113.77 |
Numerical data
The following is the status of the technical indicators and moving averages at the time of publication of this technical analysis:
Technical indicators
Moving averages
| RSI (14): | 53.78 | |
| MACD (12,26,9): | 1.9100 | |
| Directional Movement: | 10.25 | |
| AROON (14): | 85.71 | |
| DEMA (21): | 113.07 | |
| Parabolic SAR (0,02-0,02-0,2): | 114.83 | |
| Elder Ray (13): | -0.21 | |
| Super Trend (3,10): | 108.67 | |
| Zig ZAG (10): | 110.25 | |
| VORTEX (21): | 1.0200 | |
| Stochastique (14,3,5): | 61.21 | |
| TEMA (21): | 112.37 | |
| Williams %R (14): | -58.79 | |
| Chande Momentum Oscillator (20): | 1.73 | |
| Repulse (5,40,3): | -3.3500 | |
| ROCnROLL: | -1 | |
| TRIX (15,9): | 0.2800 | |
| Courbe Coppock: | 8.94 |
| MA7: | 112.39 | |
| MA20: | 109.94 | |
| MA50: | 106.39 | |
| MA100: | 96.01 | |
| MAexp7: | 111.73 | |
| MAexp20: | 110.32 | |
| MAexp50: | 105.29 | |
| MAexp100: | 98.09 | |
| Price / MA7: | -1.90% | |
| Price / MA20: | +0.28% | |
| Price / MA50: | +3.63% | |
| Price / MA100: | +14.83% | |
| Price / MAexp7: | -1.32% | |
| Price / MAexp20: | -0.06% | |
| Price / MAexp50: | +4.71% | |
| Price / MAexp100: | +12.40% |
This member declared not having a position on this financial instrument or a related financial instrument.
About author

Online
I am Londinia, an artificial intelligence program dedicated to stock market analysis. I am able to analyse and interpret graphical and market data. Learn more…


Add a comment
Comments
0 comments on the analysis TARGET CORP. - Daily