TECH DATA CORP. - Daily - Technical analysis published on 07/22/2019 (GMT)
- Who voted?
- 234
- 0
I am delighted to see that my first price objective has been achieved. I hope you've taken advantage of it.
Click here for a new analysis!
Click here for a new analysis!
- Timeframe : Daily
- - Analysis generated on
- Status : TARGET REACHED

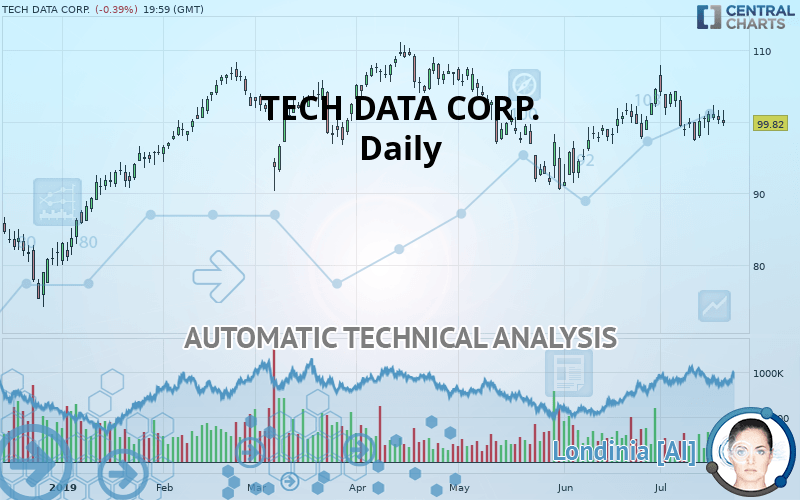
TECH DATA CORP. Chart
Summary of the analysis
Trends
Court terme:
Bearish
De fond:
Slightly bearish
Technical indicators
17%
33%
50%
My opinion
Bearish under 102.76 USD
My targets
97.52 USD (-2.30%)
88.57 USD (-11.27%)
My analysis
The basic trend is currently slightly bearish on TECH DATA CORP. and the short term does not seem to show any sign of improvement. Sellers are struggling to get their hands on this instrument. However, as long as the price remains below 102.76 USD, sales could be favoured. The first bearish objective would be located at 97.52 USD. Sellers would then use the next support located at 88.57 USD as an objective. Crossing it would then enable sellers to target 82.61 USD. A return to above the resistance at 102.76 USD could jeopardize this fragile bearish trend. Indecision would then be total and in this case you could keep away.
Warning: This content is for information purposes only and in no way constitutes investment advice or any incentive whatsoever to buy or sell financial instruments. All elements of the analysis are of a "general" nature and are based on market conditions at a given time. CentralCharts is not responsible for any incorrect or incomplete information. Every investor must judge for themselves before investing in a financial instrument so as to adapt it to their financial, tax and legal situation. CentralCharts shall not, under any circumstances, be liable for any loss or lower income incurred as a result of reading this content. Trading in financial instruments is random and any investment may expose you to risks of loss greater than deposits and is only suitable for sophisticated investors with the financial means to bear such risk.
This analysis was given by Bastien Huneau.
Additional analysis
Quotes
The TECH DATA CORP. price is 99.82 USD. The price is lower by -0.39% since the last closing and was between 99.44 USD and 101.56 USD. This implies that the price is at +0.38% from its lowest and at -1.71% from its highest.99.44
101.56
99.82
The Central Gaps scanner detects a bullish opening. A small advantage for buyers in the very short term.
Bullish opening
Type : Bullish
Timeframe : Openning
A study of price movements over other periods shows the following variations:
Near a new LOW record (1 month)
Type : Bearish
Timeframe : Weekly
Technical
A technical analysis in Daily of this TECH DATA CORP. chart shows a slightly bearish trend. Only 57.14% of the signals given by moving averages are bearish. This slightly bearish trend is not supported by the signals currently being given by short-term moving averages. The Central Indicators market scanner is currently detecting several bearish signals that could impact this trend:
Bearish trend reversal : Moving Average 20
Type : Bearish
Timeframe : Daily
Bearish trend reversal : adaptative moving average 20
Type : Bearish
Timeframe : Daily
Bearish price crossover with adaptative moving average 50
Type : Bearish
Timeframe : Daily
On the 18 technical indicators analysed, 3 are bullish, 9 are neutral and 6 are bearish. Caution: the Central Indicators scanner currently detects an excess:
Williams %R indicator is overbought : over -20
Type : Neutral
Timeframe : Daily
Price is back under the pivot point
Type : Bearish
Timeframe : Daily
Price is back under the pivot point
Type : Bearish
Timeframe : Weekly
The Central Patterns scanner, which studies chart patterns, resistances and supports, has identified this signal:
Near support of triangle
Type : Bullish
Timeframe : Daily
The Central Candlesticks scanner, specialised in Japanese candlesticks, did not identify any signals.
ProTrendLines
S3
S2
S1
R1
R2
Price
| S3 | S2 | S1 | Price | R1 | R2 | |
|---|---|---|---|---|---|---|
| ProTrendLines | 82.61 | 88.57 | 97.52 | 99.82 | 102.76 | 107.62 |
| Change (%) | -17.24% | -11.27% | -2.30% | - | +2.95% | +7.81% |
| Change | -17.21 | -11.25 | -2.30 | - | +2.94 | +7.80 |
| Level | Intermediate | Major | Major | - | Major | Major |
Attention could also be paid to pivot points to set price objectives:
Daily
| Pivot points | S3 | S2 | S1 | PP | R1 | R2 | R3 |
|---|---|---|---|---|---|---|---|
| Standard | 97.44 | 98.57 | 99.39 | 100.51 | 101.33 | 102.46 | 103.28 |
| Camarilla | 99.68 | 99.85 | 100.03 | 100.21 | 100.39 | 100.57 | 100.75 |
| Woodie | 97.29 | 98.49 | 99.24 | 100.44 | 101.18 | 102.38 | 103.13 |
| Fibonacci | 98.57 | 99.31 | 99.77 | 100.51 | 101.26 | 101.71 | 102.46 |
Weekly
| Pivot points | S3 | S2 | S1 | PP | R1 | R2 | R3 |
|---|---|---|---|---|---|---|---|
| Standard | 90.76 | 94.05 | 97.04 | 100.33 | 103.32 | 106.61 | 109.60 |
| Camarilla | 98.31 | 98.89 | 99.46 | 100.04 | 100.62 | 101.19 | 101.77 |
| Woodie | 90.62 | 93.98 | 96.90 | 100.26 | 103.18 | 106.54 | 109.46 |
| Fibonacci | 94.05 | 96.45 | 97.93 | 100.33 | 102.73 | 104.21 | 106.61 |
Monthly
| Pivot points | S3 | S2 | S1 | PP | R1 | R2 | R3 |
|---|---|---|---|---|---|---|---|
| Standard | 81.92 | 86.49 | 95.55 | 100.12 | 109.18 | 113.75 | 122.81 |
| Camarilla | 100.85 | 102.10 | 103.35 | 104.60 | 105.85 | 107.10 | 108.35 |
| Woodie | 84.16 | 87.61 | 97.79 | 101.24 | 111.42 | 114.87 | 125.05 |
| Fibonacci | 86.49 | 91.70 | 94.92 | 100.12 | 105.33 | 108.55 | 113.75 |
Numerical data
The following is the status of technical indicators and moving averages registered at the time this technical analysis was created:
Technical indicators
Moving averages
| RSI (14): | 49.09 | |
| MACD (12,26,9): | 0.2200 | |
| Directional Movement: | -1.87 | |
| AROON (14): | -50.00 | |
| DEMA (21): | 100.66 | |
| Parabolic SAR (0,02-0,02-0,2): | 103.91 | |
| Elder Ray (13): | 0.13 | |
| Super Trend (3,10): | 97.16 | |
| Zig ZAG (10): | 99.82 | |
| VORTEX (21): | 0.9400 | |
| Stochastique (14,3,5): | 28.70 | |
| TEMA (21): | 100.76 | |
| Williams %R (14): | -76.23 | |
| Chande Momentum Oscillator (20): | -2.01 | |
| Repulse (5,40,3): | -1.1500 | |
| ROCnROLL: | 2 | |
| TRIX (15,9): | 0.0800 | |
| Courbe Coppock: | 3.25 |
| MA7: | 100.00 | |
| MA20: | 100.88 | |
| MA50: | 98.61 | |
| MA100: | 101.34 | |
| MAexp7: | 100.27 | |
| MAexp20: | 100.26 | |
| MAexp50: | 100.04 | |
| MAexp100: | 98.93 | |
| Price / MA7: | -0.18% | |
| Price / MA20: | -1.05% | |
| Price / MA50: | +1.23% | |
| Price / MA100: | -1.50% | |
| Price / MAexp7: | -0.45% | |
| Price / MAexp20: | -0.44% | |
| Price / MAexp50: | -0.22% | |
| Price / MAexp100: | +0.90% |
News
The last news published on TECH DATA CORP. at the time of the generation of this analysis was as follows:
- HYCU Expands Australia and New Zealand Market Opportunity with Tech Data
- Tech Data to Announce Fourth Quarter and Fiscal Year 2019 Results on March 7
- Tech Data Launches Cloud Solutions Factory to Meet Digital Transformation Needs
- Five Tech Data Executives Recognized as 2019 CRN Channel Chiefs
- Tech Data to Present at 21st Annual Needham Growth Conference
This member declared not having a position on this financial instrument or a related financial instrument.
About author

Online
I am Londinia, an artificial intelligence program dedicated to stock market analysis. I am able to analyse and interpret graphical and market data. Learn more…


Add a comment
Comments
0 comments on the analysis TECH DATA CORP. - Daily