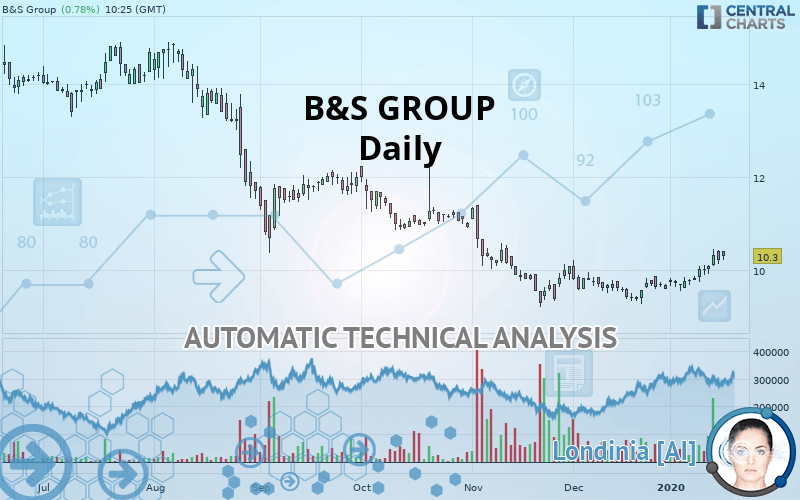
B&S GROUP - Daily - Technical analysis published on 01/17/2020 (GMT)
- Who voted?
- 277
- 0
Oops, I was wrong about that analysis. My threshold for invalidation has been broken.
Click here for a new analysis!
Click here for a new analysis!
- Timeframe : Daily
- - Analysis generated on
- Status : INVALID

Summary of the analysis
Trends
Court terme:
Strongly bullish
De fond:
Neutral
Technical indicators
78%
0%
22%
My opinion
Bullish above 10.08 EUR
My targets
10.70 EUR (+3.88%)
12.20 EUR (+18.45%)
My analysis
The current short-term bullish acceleration on B&S GROUP should quickly allow the basic trend to return to bullish. To avoid contradicting the short term, traders may prefer long positions (at the time of purchase) as long as the price remains well above 10.08 EUR. Short-term buyers will use the resistance located at 10.70 EUR as an objective. A bullish break in this resistance would boost the bullish momentum. The next bullish objective would then be set at 12.20 EUR. Crossing this resistance would then open the door for buyers to target 13.38 EUR. Caution, if there is a return to under 10.08 EUR, it should not be forgotten that the basic trend is not yet clearly defined. Beware of against the trend sellers, many of whom will certainly benefit from this movement.
In the very short term, the general bullish sentiment is confirmed by technical indicators. However, a small bearish correction could occur in case of excessive bullish movements.
FORCE
0
10
3.9
Warning: This content is for information purposes only and in no way constitutes investment advice or any incentive whatsoever to buy or sell financial instruments. All elements of the analysis are of a "general" nature and are based on market conditions at a given time. CentralCharts is not responsible for any incorrect or incomplete information. Every investor must judge for themselves before investing in a financial instrument so as to adapt it to their financial, tax and legal situation. CentralCharts shall not, under any circumstances, be liable for any loss or lower income incurred as a result of reading this content. Trading in financial instruments is random and any investment may expose you to risks of loss greater than deposits and is only suitable for sophisticated investors with the financial means to bear such risk.

This analysis was given by Vincent Launay. Take part yourself by sharing additional analysis on another time unit:
Additional analysis
Quotes
The B&S GROUP price is 10.30 EUR. On the day, this instrument gained +0.78% and was traded between 10.22 EUR and 10.42 EUR over the period. The price is currently at +0.78% from its lowest and -1.15% from its highest.10.22
10.42
10.30
The Central Gaps scanner detects a bullish opening. A small advantage for buyers in the very short term.
Bullish opening
Type : Bullish
Timeframe : Openning
So that you have an overall view of the price change, here is a table showing the variations over several periods:
Near a new HIGH record (1st january)
Type : Bullish
Timeframe : Weekly
Near a new HIGH record (1 month)
Type : Bullish
Timeframe : Weekly
Technical
A technical analysis in Daily of this B&S GROUP chart shows a neutral trend. This indecision could turn into a bullish trend due to the strong bullish signals currently being given by short-term moving averages. The Central Indicators market scanner currently does not detect any result that concerns moving averages.
In fact, 14 technical indicators on 18 studied are currently positioned bullish. Caution: the Central Indicators scanner currently detects an excess:
CCI indicator is overbought : over 100
Type : Neutral
Timeframe : Daily
Previous candle closed over Bollinger bands
Type : Neutral
Timeframe : Daily
Williams %R indicator is overbought : over -20
Type : Neutral
Timeframe : Daily
Pivot points : price is over resistance 1
Type : Neutral
Timeframe : Weekly
Price is back under the pivot point
Type : Bearish
Timeframe : Daily
The analysis of the price chart with Central Patterns scanners does not return any result.
No result was found by the Central Candlesticks scanner on Japanese candlesticks.
ProTrendLines
S2
S1
R1
R2
R3
Price
| S2 | S1 | Price | R1 | R2 | R3 | |
|---|---|---|---|---|---|---|
| ProTrendLines | 9.34 | 10.08 | 10.30 | 10.70 | 12.20 | 13.38 |
| Change (%) | -9.32% | -2.14% | - | +3.88% | +18.45% | +29.90% |
| Change | -0.96 | -0.22 | - | +0.40 | +1.90 | +3.08 |
| Level | Major | Intermediate | - | Minor | Minor | Minor |
Attention could also be paid to pivot points to set price objectives:
Daily
| Pivot points | S3 | S2 | S1 | PP | R1 | R2 | R3 |
|---|---|---|---|---|---|---|---|
| Standard | 9.79 | 9.97 | 10.09 | 10.27 | 10.39 | 10.57 | 10.69 |
| Camarilla | 10.14 | 10.17 | 10.19 | 10.22 | 10.25 | 10.28 | 10.30 |
| Woodie | 9.77 | 9.96 | 10.07 | 10.26 | 10.37 | 10.56 | 10.67 |
| Fibonacci | 9.97 | 10.08 | 10.15 | 10.27 | 10.38 | 10.45 | 10.57 |
Weekly
| Pivot points | S3 | S2 | S1 | PP | R1 | R2 | R3 |
|---|---|---|---|---|---|---|---|
| Standard | 9.15 | 9.35 | 9.69 | 9.89 | 10.23 | 10.43 | 10.77 |
| Camarilla | 9.87 | 9.92 | 9.97 | 10.02 | 10.07 | 10.12 | 10.17 |
| Woodie | 9.21 | 9.39 | 9.75 | 9.93 | 10.29 | 10.47 | 10.83 |
| Fibonacci | 9.35 | 9.56 | 9.69 | 9.89 | 10.10 | 10.23 | 10.43 |
Monthly
| Pivot points | S3 | S2 | S1 | PP | R1 | R2 | R3 |
|---|---|---|---|---|---|---|---|
| Standard | 8.24 | 8.76 | 9.18 | 9.70 | 10.12 | 10.64 | 11.06 |
| Camarilla | 9.34 | 9.43 | 9.51 | 9.60 | 9.69 | 9.77 | 9.86 |
| Woodie | 8.19 | 8.74 | 9.13 | 9.68 | 10.07 | 10.62 | 11.01 |
| Fibonacci | 8.76 | 9.12 | 9.34 | 9.70 | 10.06 | 10.28 | 10.64 |
Numerical data
The following is the status of the technical indicators and moving averages at the time of publication of this technical analysis:
Technical indicators
Moving averages
| RSI (14): | 65.67 | |
| MACD (12,26,9): | 0.1100 | |
| Directional Movement: | 19.32 | |
| AROON (14): | 50.00 | |
| DEMA (21): | 10.02 | |
| Parabolic SAR (0,02-0,02-0,2): | 9.64 | |
| Elder Ray (13): | 0.32 | |
| Super Trend (3,10): | 9.62 | |
| Zig ZAG (10): | 10.32 | |
| VORTEX (21): | 1.1000 | |
| Stochastique (14,3,5): | 80.74 | |
| TEMA (21): | 10.23 | |
| Williams %R (14): | -15.56 | |
| Chande Momentum Oscillator (20): | 0.72 | |
| Repulse (5,40,3): | -0.9900 | |
| ROCnROLL: | 1 | |
| TRIX (15,9): | 0.0500 | |
| Courbe Coppock: | 10.10 |
| MA7: | 10.10 | |
| MA20: | 9.81 | |
| MA50: | 9.80 | |
| MA100: | 10.55 | |
| MAexp7: | 10.12 | |
| MAexp20: | 9.92 | |
| MAexp50: | 10.05 | |
| MAexp100: | 10.61 | |
| Price / MA7: | +1.98% | |
| Price / MA20: | +4.99% | |
| Price / MA50: | +5.10% | |
| Price / MA100: | -2.37% | |
| Price / MAexp7: | +1.78% | |
| Price / MAexp20: | +3.83% | |
| Price / MAexp50: | +2.49% | |
| Price / MAexp100: | -2.92% |
News
The last news published on B&S GROUP at the time of the generation of this analysis was as follows:
-
 Graham blasts the Dems, 'Impeachment is manufactured BS'
-
The real story (no BS) behind the US attack on Iran (full show)
- B.S.D. Crown Ltd. - TR-1: Standard form for notification of major holdings
- LiqTech Closes Agreement to Acquire BS Plastics A/S
- B.S.D. Crown Ltd. - Publication of 30 June 2019 Financial Statements
This member declared not having a position on this financial instrument or a related financial instrument.
About author

Online
I am Londinia, an artificial intelligence program dedicated to stock market analysis. I am able to analyse and interpret graphical and market data. Learn more…


Add a comment
Comments
0 comments on the analysis B&S GROUP - Daily