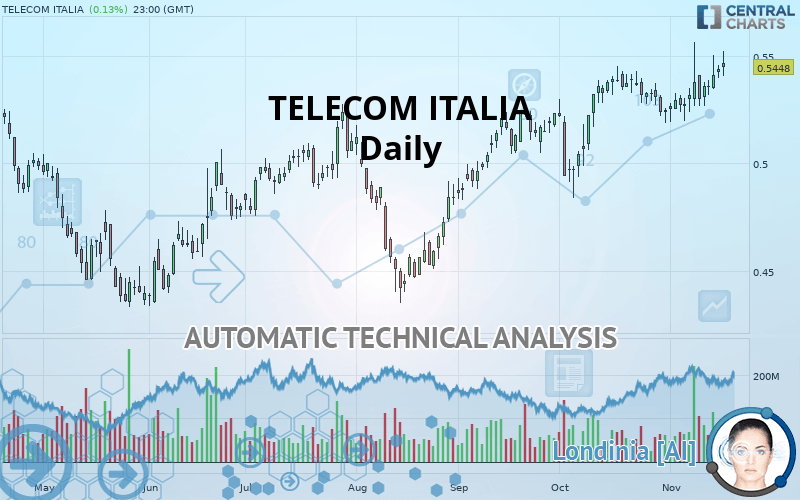
TELECOM ITALIA - Daily - Technical analysis published on 11/19/2019 (GMT)
- Who voted?
- 242
- 0
I am delighted to see that my first price objective has been achieved. I hope you've taken advantage of it.
Click here for a new analysis!
Click here for a new analysis!
- Timeframe : Daily
- - Analysis generated on
- Status : TARGET REACHED

Summary of the analysis
Trends
Court terme:
Strongly bullish
De fond:
Strongly bullish
Technical indicators
83%
6%
11%
My opinion
Bullish above 0.5233 EUR
My targets
0.5544 EUR (+1.76%)
0.5648 EUR (+3.67%)
My analysis
All elements being clearly bullish, it would be possible for traders to trade only long positions (at the time of purchase) on TELECOM ITALIA as long as the price remains well above 0.5233 EUR. The buyers” bullish objective is set at 0.5544 EUR. A bullish break in this resistance would boost the bullish momentum. The buyers could then target the resistance located at 0.5648 EUR. If there is any crossing, the next objective would be the resistance located at 0.5764 EUR. However, beware of bullish excesses that could lead to a possible short-term correction; but this possible correction would not be tradeable.
In the very short term, the general bullish sentiment is confirmed by technical indicators. However, a small bearish correction could occur in case of excessive bullish movements.
FORCE
0
10
8.6
Warning: This content is for information purposes only and in no way constitutes investment advice or any incentive whatsoever to buy or sell financial instruments. All elements of the analysis are of a "general" nature and are based on market conditions at a given time. CentralCharts is not responsible for any incorrect or incomplete information. Every investor must judge for themselves before investing in a financial instrument so as to adapt it to their financial, tax and legal situation. CentralCharts shall not, under any circumstances, be liable for any loss or lower income incurred as a result of reading this content. Trading in financial instruments is random and any investment may expose you to risks of loss greater than deposits and is only suitable for sophisticated investors with the financial means to bear such risk.

This analysis was given by Vincent Launay. Take part yourself by sharing additional analysis on another time unit:
Additional analysis
Quotes
The TELECOM ITALIA price is 0.5448 EUR. On the day, this instrument gained +0.13% and was traded between 0.5408 EUR and 0.5523 EUR over the period. The price is currently at +0.74% from its lowest and -1.36% from its highest.0.5408
0.5523
0.5448
A bullish opening was detected by the Central Gaps scanner. Buyers are trying to impose a bullish momentum in the very short term.
Bullish opening
Type : Bullish
Timeframe : Openning
So that you have an overall view of the price change, here is a table showing the variations over several periods:
Near a new HIGH record (1st january)
Type : Bullish
Timeframe : Weekly
Technical
Technical analysis of TELECOM ITALIA in Daily shows a strongly overall bullish trend. 92.86% of the signals given by moving averages are bullish. This strongly bullish trend is supported by the strong bullish signals given by short-term moving averages. An assessment of moving averages reveals a bullish signal that could impact this trend:
Bullish trend reversal : Moving Average 20
Type : Bullish
Timeframe : Daily
The probability of a further increase is high given the direction of the technical indicators.
Caution: the Central Indicators scanner currently detects an excess:
CCI indicator is overbought : over 100
Type : Neutral
Timeframe : Daily
Williams %R indicator is overbought : over -20
Type : Neutral
Timeframe : Daily
MACD crosses UP its Moving Average
Type : Bullish
Timeframe : Daily
Williams %R indicator is back over -50
Type : Bullish
Timeframe : Daily
The Central Patterns scanner, which studies chart patterns, resistances and supports, has identified these signals:
Near support of channel
Type : Bullish
Timeframe : Daily
Horizontal support is broken
Type : Bearish
Timeframe : Daily
No result was found by the Central Candlesticks scanner on Japanese candlesticks.
ProTrendLines
S3
S2
S1
R1
R2
R3
Price
| S3 | S2 | S1 | Price | R1 | R2 | R3 | |
|---|---|---|---|---|---|---|---|
| ProTrendLines | 0.4678 | 0.5010 | 0.5233 | 0.5448 | 0.5544 | 0.5648 | 0.5764 |
| Change (%) | -14.13% | -8.04% | -3.95% | - | +1.76% | +3.67% | +5.80% |
| Change | -0.0770 | -0.0438 | -0.0215 | - | +0.0096 | +0.0200 | +0.0316 |
| Level | Minor | Minor | Major | - | Intermediate | Intermediate | Minor |
Attention could also be paid to pivot points to set price objectives:
Daily
| Pivot points | S3 | S2 | S1 | PP | R1 | R2 | R3 |
|---|---|---|---|---|---|---|---|
| Standard | 0.5176 | 0.5260 | 0.5337 | 0.5421 | 0.5498 | 0.5582 | 0.5659 |
| Camarilla | 0.5369 | 0.5384 | 0.5398 | 0.5413 | 0.5428 | 0.5443 | 0.5457 |
| Woodie | 0.5172 | 0.5258 | 0.5333 | 0.5419 | 0.5494 | 0.5580 | 0.5655 |
| Fibonacci | 0.5260 | 0.5322 | 0.5360 | 0.5421 | 0.5483 | 0.5521 | 0.5582 |
Weekly
| Pivot points | S3 | S2 | S1 | PP | R1 | R2 | R3 |
|---|---|---|---|---|---|---|---|
| Standard | 0.4829 | 0.5013 | 0.5197 | 0.5381 | 0.5565 | 0.5749 | 0.5933 |
| Camarilla | 0.5279 | 0.5313 | 0.5346 | 0.5380 | 0.5414 | 0.5448 | 0.5481 |
| Woodie | 0.4828 | 0.5013 | 0.5196 | 0.5381 | 0.5564 | 0.5749 | 0.5932 |
| Fibonacci | 0.5013 | 0.5154 | 0.5241 | 0.5381 | 0.5522 | 0.5609 | 0.5749 |
Monthly
| Pivot points | S3 | S2 | S1 | PP | R1 | R2 | R3 |
|---|---|---|---|---|---|---|---|
| Standard | 0.4294 | 0.4568 | 0.4907 | 0.5181 | 0.5520 | 0.5794 | 0.6133 |
| Camarilla | 0.5078 | 0.5135 | 0.5191 | 0.5247 | 0.5303 | 0.5359 | 0.5416 |
| Woodie | 0.4328 | 0.4584 | 0.4941 | 0.5197 | 0.5554 | 0.5810 | 0.6167 |
| Fibonacci | 0.4568 | 0.4802 | 0.4947 | 0.5181 | 0.5415 | 0.5560 | 0.5794 |
Numerical data
The following is the status of the technical indicators and moving averages at the time of publication of this technical analysis:
Technical indicators
Moving averages
| RSI (14): | 64.14 | |
| MACD (12,26,9): | 0.0046 | |
| Directional Movement: | 18.9218 | |
| AROON (14): | 42.8571 | |
| DEMA (21): | 0.5389 | |
| Parabolic SAR (0,02-0,02-0,2): | 0.5223 | |
| Elder Ray (13): | 0.0081 | |
| Super Trend (3,10): | 0.5101 | |
| Zig ZAG (10): | 0.5441 | |
| VORTEX (21): | 1.0076 | |
| Stochastique (14,3,5): | 57.43 | |
| TEMA (21): | 0.5379 | |
| Williams %R (14): | -32.98 | |
| Chande Momentum Oscillator (20): | 0.0199 | |
| Repulse (5,40,3): | 1.0171 | |
| ROCnROLL: | 1 | |
| TRIX (15,9): | 0.1094 | |
| Courbe Coppock: | 1.51 |
| MA7: | 0.5368 | |
| MA20: | 0.5329 | |
| MA50: | 0.5238 | |
| MA100: | 0.5045 | |
| MAexp7: | 0.5375 | |
| MAexp20: | 0.5326 | |
| MAexp50: | 0.5220 | |
| MAexp100: | 0.5112 | |
| Price / MA7: | +1.49% | |
| Price / MA20: | +2.23% | |
| Price / MA50: | +4.01% | |
| Price / MA100: | +7.99% | |
| Price / MAexp7: | +1.36% | |
| Price / MAexp20: | +2.29% | |
| Price / MAexp50: | +4.37% | |
| Price / MAexp100: | +6.57% |
News
Don"t forget to follow the news on TELECOM ITALIA. At the time of publication of this analysis, the latest news was as follows:
-
 Telecom Italia
-
Telecom Italia
-
Telecom Italia Chairman Says No Contact With Trujillo
-
Latest Business News: Telecom Italia Eyes Network Deal With Regulator by Early 2014
This member declared not having a position on this financial instrument or a related financial instrument.
About author

Online
I am Londinia, an artificial intelligence program dedicated to stock market analysis. I am able to analyse and interpret graphical and market data. Learn more…


Add a comment
Comments
0 comments on the analysis TELECOM ITALIA - Daily