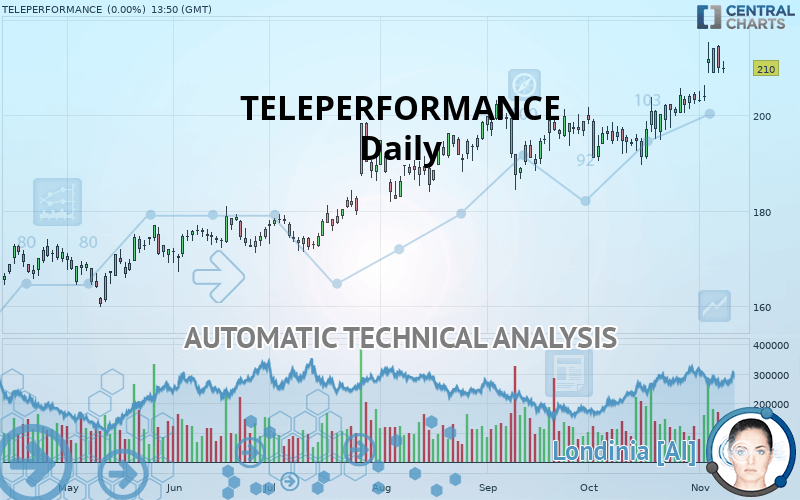
TELEPERFORMANCE - Daily - Technical analysis published on 11/08/2019 (GMT)
- 347
- 0
Click here for a new analysis!
- Timeframe : Daily
- - Analysis generated on
- Status : TARGET REACHED

Summary of the analysis

Additional analysis
Quotes
TELEPERFORMANCE rating 210.0 EUR. The price registered an increase of +0.00% on the session and was between 209.0 EUR and 211.4 EUR. This implies that the price is at +0.48% from its lowest and at -0.66% from its highest.A bearish opening was detected by the Central Gaps scanner. Sellers are trying to impose a bearish trend in the very short term.
Bearish opening
Type : Bearish
Timeframe : Openning
A study of price movements over other periods shows the following variations:
New HIGH record (5 years)
Type : Bullish
Timeframe : Weekly
Near a new HIGH record (1st january)
Type : Bullish
Timeframe : Weekly
Near a new HIGH record (1 month)
Type : Bullish
Timeframe : Weekly
Technical
Technical analysis of this Daily chart of TELEPERFORMANCE indicates that the overall trend is strongly bullish. 92.86% of the signals given by moving averages are bullish. The overall trend is supported by the strong bullish signals from short-term moving averages. The Central Indicators scanner does not detect any result on moving averages that would impact this trend.
In fact, according to the parameters integrated into the Central Analyzer system, 14 technical indicators out of 18 analysed are currently bullish. Caution: the Central Indicators scanner currently detects an excess:
CCI indicator is overbought : over 100
Type : Neutral
Timeframe : Daily
Previous candle closed over Bollinger bands
Type : Neutral
Timeframe : Daily
Williams %R indicator is overbought : over -20
Type : Neutral
Timeframe : Daily
Pivot points : price is over resistance 2
Type : Neutral
Timeframe : Weekly
Price is back under the pivot point
Type : Bearish
Timeframe : Daily
An analysis of the price chart with the Central Patterns scanner (detector of chart patterns and resistances and supports) shows a result that can have an impact on the price change:
Resistance of channel is broken
Type : Bullish
Timeframe : Daily
The presence of a bearish pattern in Japanese candlesticks detected by Central Candlesticks that could cause a correction in the very short term was also detected:
Dark cloud cover
Type : Bearish
Timeframe : Daily
| S3 | S2 | S1 | Price | |
|---|---|---|---|---|
| ProTrendLines | 170.6 | 191.2 | 202.4 | 210.0 |
| Change (%) | -18.76% | -8.95% | -3.62% | - |
| Change | -39.4 | -18.8 | -7.6 | - |
| Level | Major | Major | Major | - |
To determine price objectives, it is also possible to use the pivot points. Here is the price position in relation to pivot points:
| Pivot points | S3 | S2 | S1 | PP | R1 | R2 | R3 |
|---|---|---|---|---|---|---|---|
| Standard | 201.9 | 205.5 | 207.7 | 211.3 | 213.5 | 217.1 | 219.3 |
| Camarilla | 208.4 | 208.9 | 209.5 | 210.0 | 210.5 | 211.1 | 211.6 |
| Woodie | 201.3 | 205.2 | 207.1 | 211.0 | 212.9 | 216.8 | 218.7 |
| Fibonacci | 205.5 | 207.7 | 209.1 | 211.3 | 213.5 | 214.9 | 217.1 |
| Pivot points | S3 | S2 | S1 | PP | R1 | R2 | R3 |
|---|---|---|---|---|---|---|---|
| Standard | 194.9 | 197.7 | 200.3 | 203.1 | 205.7 | 208.5 | 211.1 |
| Camarilla | 201.5 | 202.0 | 202.5 | 203.0 | 203.5 | 204.0 | 204.5 |
| Woodie | 194.9 | 197.7 | 200.3 | 203.1 | 205.7 | 208.5 | 211.1 |
| Fibonacci | 197.7 | 199.7 | 201.0 | 203.1 | 205.1 | 206.4 | 208.5 |
| Pivot points | S3 | S2 | S1 | PP | R1 | R2 | R3 |
|---|---|---|---|---|---|---|---|
| Standard | 176.9 | 183.2 | 193.2 | 199.5 | 209.5 | 215.8 | 225.8 |
| Camarilla | 198.7 | 200.2 | 201.7 | 203.2 | 204.7 | 206.2 | 207.7 |
| Woodie | 178.8 | 184.1 | 195.1 | 200.4 | 211.4 | 216.7 | 227.7 |
| Fibonacci | 183.2 | 189.4 | 193.3 | 199.5 | 205.7 | 209.6 | 215.8 |
Numerical data
The following are the details of the technical indicators and moving averages that were collected to generate this technical analysis:
| RSI (14): | 62.60 | |
| MACD (12,26,9): | 3.8000 | |
| Directional Movement: | 21.3 | |
| AROON (14): | 71.5 | |
| DEMA (21): | 208.6 | |
| Parabolic SAR (0,02-0,02-0,2): | 197.9 | |
| Elder Ray (13): | 4.1 | |
| Super Trend (3,10): | 198.4 | |
| Zig ZAG (10): | 210.0 | |
| VORTEX (21): | 1.1000 | |
| Stochastique (14,3,5): | 80.60 | |
| TEMA (21): | 210.6 | |
| Williams %R (14): | -26.20 | |
| Chande Momentum Oscillator (20): | 7.8 | |
| Repulse (5,40,3): | -0.1000 | |
| ROCnROLL: | 1 | |
| TRIX (15,9): | 0.2000 | |
| Courbe Coppock: | 11.20 |
| MA7: | 208.2 | |
| MA20: | 202.4 | |
| MA50: | 198.4 | |
| MA100: | 191.1 | |
| MAexp7: | 208.6 | |
| MAexp20: | 204.0 | |
| MAexp50: | 198.7 | |
| MAexp100: | 191.6 | |
| Price / MA7: | +0.86% | |
| Price / MA20: | +3.75% | |
| Price / MA50: | +5.85% | |
| Price / MA100: | +9.89% | |
| Price / MAexp7: | +0.67% | |
| Price / MAexp20: | +2.94% | |
| Price / MAexp50: | +5.69% | |
| Price / MAexp100: | +9.60% |
News
The last news published on TELEPERFORMANCE at the time of the generation of this analysis was as follows:
- Teleperformance Steps up Its Digital Integration and Expands Its Portfolio of Business Service Solutions
- Teleperformance: Statement on transactions of purchase of own shares carried on October 1st, 2019
- Teleperformance Named 2019 Asia-Pacific Contact Center Outsourcing Service Provider of the Year by Frost & Sullivan
- Teleperformance: Monthly Information Regarding Shares and Voting Rights
- Teleperformance: Description of the Share Repurchase Program Submitted by the Board of Directors to the Approval of the Shareholders’ Meeting to Be Held on October 1, 2019 (1st Resolution)
About author

Online


Add a comment
Comments
0 comments on the analysis TELEPERFORMANCE - Daily