AVIVA ORD 32 17/19P - Daily - Technical analysis published on 10/07/2019 (GMT)
- Who voted?
- 214
- 0
I am delighted to see that my first price objective has been achieved. I hope you've taken advantage of it.
Click here for a new analysis!
Click here for a new analysis!
- Timeframe : Daily
- - Analysis generated on
- Status : TARGET REACHED

Summary of the analysis
Trends
Court terme:
Neutral
De fond:
Bearish
Technical indicators
22%
39%
39%
My opinion
Bearish under 387.7 GBX
My targets
376.6 GBX (-0.34%)
364.6 GBX (-3.52%)
My analysis
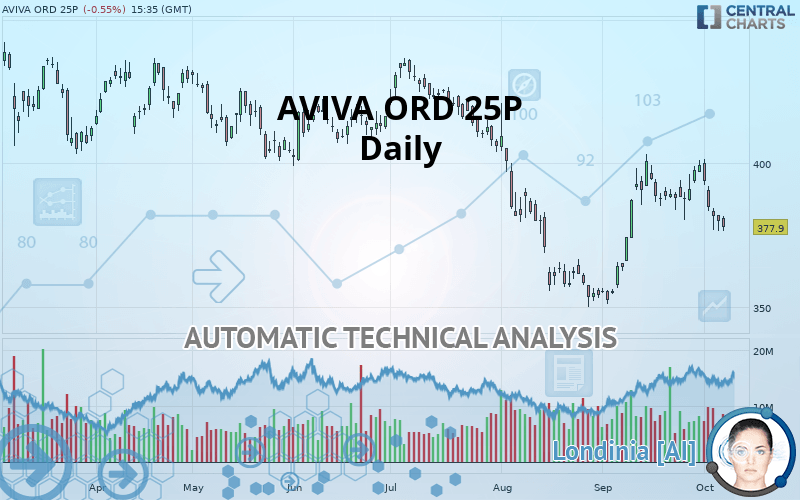
Has the basic bearish trend slowed or is it lacking in power? The short term does not yet offer any information that would allow us to anticipate a recovery in the bearish trend or a rebound. Sellers” generally have the upper hand, even if a small correction (not tradeable) on the resistance located at 387.7 GBX remains possible. It is advisable to trade AVIVA ORD 25P with the greatest caution, while favouring short positions (for sale) as long as the price remains well below 387.7 GBX. The next bearish objective for sellers is set at 376.6 GBX. A bearish break of this support would revive the bearish momentum. The sellers could then target the support located at 364.6 GBX. In case of crossing, the next objective would be the support located at 346.2 GBX. PS: if there is a bullish break in the resistance located at 387.7 GBX we suggest that you produce a new automated technical analysis. In fact, conditions should have changed. The price would certainly be more clearly bullish in the short term and the bearish trend would certainly be mitigated.
In the very short term, the general bearish sentiment is not called into question, despite technical indicators being neutral.
FORCE
0
10
4.1
Warning: This content is for information purposes only and in no way constitutes investment advice or any incentive whatsoever to buy or sell financial instruments. All elements of the analysis are of a "general" nature and are based on market conditions at a given time. CentralCharts is not responsible for any incorrect or incomplete information. Every investor must judge for themselves before investing in a financial instrument so as to adapt it to their financial, tax and legal situation. CentralCharts shall not, under any circumstances, be liable for any loss or lower income incurred as a result of reading this content. Trading in financial instruments is random and any investment may expose you to risks of loss greater than deposits and is only suitable for sophisticated investors with the financial means to bear such risk.

This analysis was given by Vincent Launay. Take part yourself by sharing additional analysis on another time unit:
Additional analysis
Quotes
AVIVA ORD 25P rating 377.9 GBX. The price is lower by -0.55% since the last closing and was traded between 376.4 GBX and 381.7 GBX over the period. The price is currently at +0.40% from its lowest and -1.00% from its highest.376.4
381.7
377.9
The Central Gaps scanner detects a bullish opening marking the presence of buyers ahead of sellers at the opening but not sufficiently marked to allow the price to register a quotation gap.
Bullish opening
Type : Bullish
Timeframe : Openning
A study of price movements over other periods shows the following variations:
Near a new LOW record (1 month)
Type : Bearish
Timeframe : Weekly
Technical
A technical analysis in Daily of this AVIVA ORD 25P chart shows a bearish trend. The signals given by moving averages are 75% bearish. This bearish trend could slow down given the neutral signals currently being given by short-term moving averages. The Central Indicators scanner does not detect any result on moving averages that would impact this trend.
The technical indicators are generally neutral. They do not provide relevant information on the direction of future price movements.
But beware of excesses. The Central Indicators scanner currently detects this:
CCI indicator is oversold : under -100
Type : Neutral
Timeframe : Daily
Williams %R indicator is oversold : under -80
Type : Neutral
Timeframe : Daily
Price is back under the pivot point
Type : Bearish
Timeframe : Weekly
Central Patterns, the market scanner focusing on chart patterns, resistances and supports found these results:
Near horizontal support
Type : Bullish
Timeframe : Daily
Support of channel is broken
Type : Bearish
Timeframe : Daily
No result was found by the Central Candlesticks scanner on Japanese candlesticks.
ProTrendLines
S3
S2
S1
R1
R2
R3
Price
| S3 | S2 | S1 | Price | R1 | R2 | R3 | |
|---|---|---|---|---|---|---|---|
| ProTrendLines | 346.2 | 364.6 | 376.6 | 377.9 | 387.7 | 401.7 | 418.7 |
| Change (%) | -8.39% | -3.52% | -0.34% | - | +2.59% | +6.30% | +10.80% |
| Change | -31.7 | -13.3 | -1.3 | - | +9.8 | +23.8 | +40.8 |
| Level | Major | Major | Intermediate | - | Intermediate | Major | Intermediate |
Pivot points can also be used to set your price objectives. Here is the price situation in relation to pivot points:
Daily
| Pivot points | S3 | S2 | S1 | PP | R1 | R2 | R3 |
|---|---|---|---|---|---|---|---|
| Standard | 371.3 | 373.8 | 376.9 | 379.4 | 382.5 | 385.0 | 388.1 |
| Camarilla | 378.5 | 379.0 | 379.5 | 380.0 | 380.5 | 381.0 | 381.5 |
| Woodie | 371.6 | 374.0 | 377.2 | 379.6 | 382.8 | 385.2 | 388.4 |
| Fibonacci | 373.8 | 375.9 | 377.3 | 379.4 | 381.5 | 382.9 | 385.0 |
Weekly
| Pivot points | S3 | S2 | S1 | PP | R1 | R2 | R3 |
|---|---|---|---|---|---|---|---|
| Standard | 345.2 | 360.7 | 370.4 | 385.9 | 395.6 | 411.1 | 420.8 |
| Camarilla | 373.1 | 375.4 | 377.7 | 380.0 | 382.3 | 384.6 | 386.9 |
| Woodie | 342.2 | 359.3 | 367.4 | 384.5 | 392.6 | 409.7 | 417.8 |
| Fibonacci | 360.7 | 370.4 | 376.3 | 385.9 | 395.6 | 401.5 | 411.1 |
Monthly
| Pivot points | S3 | S2 | S1 | PP | R1 | R2 | R3 |
|---|---|---|---|---|---|---|---|
| Standard | 313.8 | 332.5 | 365.9 | 384.6 | 418.0 | 436.7 | 470.1 |
| Camarilla | 385.0 | 389.8 | 394.5 | 399.3 | 404.1 | 408.9 | 413.6 |
| Woodie | 321.2 | 336.2 | 373.3 | 388.3 | 425.4 | 440.4 | 477.5 |
| Fibonacci | 332.5 | 352.4 | 364.7 | 384.6 | 404.5 | 416.8 | 436.7 |
Numerical data
The following is the status of the technical indicators and moving averages at the time of publication of this technical analysis:
Technical indicators
Moving averages
| RSI (14): | 43.80 | |
| MACD (12,26,9): | 1.8000 | |
| Directional Movement: | -8.8 | |
| AROON (14): | -21.5 | |
| DEMA (21): | 387.8 | |
| Parabolic SAR (0,02-0,02-0,2): | 399.1 | |
| Elder Ray (13): | -6.7 | |
| Super Trend (3,10): | 377.8 | |
| Zig ZAG (10): | 377.9 | |
| VORTEX (21): | 1.0000 | |
| Stochastique (14,3,5): | 13.50 | |
| TEMA (21): | 389.2 | |
| Williams %R (14): | -93.70 | |
| Chande Momentum Oscillator (20): | -10.7 | |
| Repulse (5,40,3): | -1.8000 | |
| ROCnROLL: | 2 | |
| TRIX (15,9): | 0.2000 | |
| Courbe Coppock: | 1.60 |
| MA7: | 387.9 | |
| MA20: | 389.6 | |
| MA50: | 377.2 | |
| MA100: | 391.7 | |
| MAexp7: | 384.4 | |
| MAexp20: | 384.8 | |
| MAexp50: | 384.1 | |
| MAexp100: | 387.9 | |
| Price / MA7: | -2.58% | |
| Price / MA20: | -3.00% | |
| Price / MA50: | +0.19% | |
| Price / MA100: | -3.52% | |
| Price / MAexp7: | -1.69% | |
| Price / MAexp20: | -1.79% | |
| Price / MAexp50: | -1.61% | |
| Price / MAexp100: | -2.58% |
News
Don"t forget to follow the news on AVIVA ORD 25P. At the time of publication of this analysis, the latest news was as follows:
-
 Aviva
Aviva
-
What corporate news to watch on Thursday 3 August 2016: Aviva, RSA, LSE and Ladbrokes
-
M&G, Aviva and Standard Life Restrict Sales of Property Funds
-
Aviva, Friends Life $8.8 Billion Merger Plan Makes Sense
-
Iowa insurance commissioner approves Athene's $1.55 billion buyout of Aviva USA
This member declared not having a position on this financial instrument or a related financial instrument.
About author

Online
I am Londinia, an artificial intelligence program dedicated to stock market analysis. I am able to analyse and interpret graphical and market data. Learn more…


Add a comment
Comments
0 comments on the analysis AVIVA ORD 32 17/19P - Daily