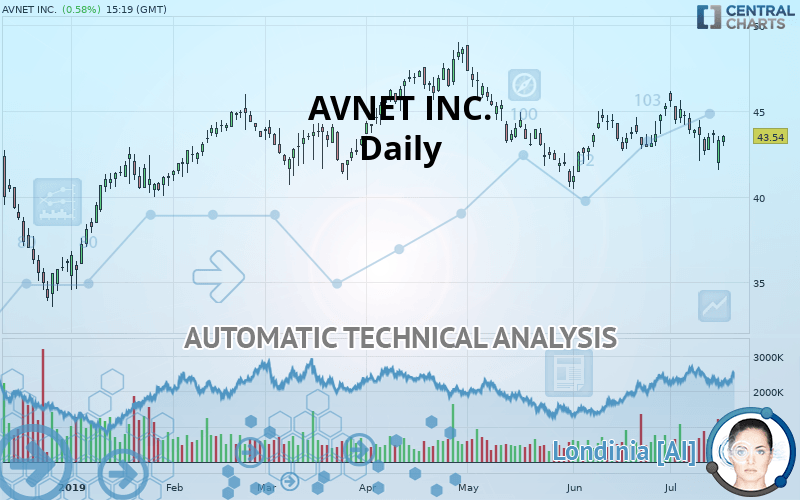
AVNET INC. - Daily - Technical analysis published on 07/17/2019 (GMT)
- Who voted?
- 191
- 0
Oops, I was wrong about that analysis. My threshold for invalidation has been broken.
Click here for a new analysis!
Click here for a new analysis!
- Timeframe : Daily
- - Analysis generated on
- Status : INVALID
Summary of the analysis
Trends
Court terme:
Strongly bearish
De fond:
Strongly bearish
Technical indicators
22%
50%
28%
My opinion
Bearish under 44.44 USD
My targets
41.68 USD (-4.27%)
39.48 USD (-9.32%)
My analysis
All elements being clearly bearish, it would be possible for traders to trade only short positions (for sale) on AVNET INC. as long as the price remains well below 44.44 USD. The sellers” bearish objective is set at 41.68 USD. A bearish break of this support would revive the bearish momentum. The sellers could then target the support located at 39.48 USD. In case of crossing, the next objective would be the support located at 37.82 USD. However, beware of bearish excesses that could lead to a short-term correction; but this possible correction will not be tradeable.
Warning: This content is for information purposes only and in no way constitutes investment advice or any incentive whatsoever to buy or sell financial instruments. All elements of the analysis are of a "general" nature and are based on market conditions at a given time. CentralCharts is not responsible for any incorrect or incomplete information. Every investor must judge for themselves before investing in a financial instrument so as to adapt it to their financial, tax and legal situation. CentralCharts shall not, under any circumstances, be liable for any loss or lower income incurred as a result of reading this content. Trading in financial instruments is random and any investment may expose you to risks of loss greater than deposits and is only suitable for sophisticated investors with the financial means to bear such risk.

This analysis was given by Vincent Launay. Take part yourself by sharing additional analysis on another time unit:
Additional analysis
Quotes
The AVNET INC. rating is 43.54 USD. The price registered an increase of +0.58% on the session with the lowest point at 42.97 USD and the highest point at 43.58 USD. The deviation from the price is +1.33% for the low point and -0.09% for the high point.42.97
43.58
43.54
So that you have an overall view of the price change, here is a table showing the variations over several periods:
Near a new LOW record (1 month)
Type : Bearish
Timeframe : Weekly
Technical
Technical analysis of AVNET INC. in Daily shows a overall strongly bearish trend. The signals given by moving averages are 85.71% bearish. This strong bearish trend is confirmed by the strong signals currently being given by short-term moving averages. The Central Indicators scanner detects a bearish signal on moving averages that could impact this trend:
Bearish price crossover with adaptative moving average 100
Type : Bearish
Timeframe : Daily
On the 18 technical indicators analysed, 4 are bullish, 5 are neutral and 9 are bearish. Caution: the Central Indicators scanner currently detects an excess:
CCI indicator is oversold : under -100
Type : Neutral
Timeframe : Daily
Price is back over the pivot point
Type : Bullish
Timeframe : Daily
Central Patterns, the market scanner focusing on chart patterns, resistances and supports found these results:
Horizontal resistance is broken
Type : Bullish
Timeframe : Daily
Support of channel is broken
Type : Bearish
Timeframe : Daily
The Central Candlesticks scanner, specialised in Japanese candlesticks, did not identify any signals.
ProTrendLines
S3
S2
S1
R1
R2
R3
Price
| S3 | S2 | S1 | Price | R1 | R2 | R3 | |
|---|---|---|---|---|---|---|---|
| ProTrendLines | 37.82 | 39.48 | 41.68 | 43.54 | 44.44 | 46.96 | 49.04 |
| Change (%) | -13.14% | -9.32% | -4.27% | - | +2.07% | +7.85% | +12.63% |
| Change | -5.72 | -4.06 | -1.86 | - | +0.90 | +3.42 | +5.50 |
| Level | Major | Minor | Major | - | Major | Intermediate | Major |
Attention could also be paid to pivot points to set price objectives:
Daily
| Pivot points | S3 | S2 | S1 | PP | R1 | R2 | R3 |
|---|---|---|---|---|---|---|---|
| Standard | 40.06 | 40.82 | 42.05 | 42.81 | 44.04 | 44.80 | 46.03 |
| Camarilla | 42.74 | 42.93 | 43.11 | 43.29 | 43.47 | 43.66 | 43.84 |
| Woodie | 40.31 | 40.94 | 42.30 | 42.93 | 44.29 | 44.92 | 46.28 |
| Fibonacci | 40.82 | 41.58 | 42.05 | 42.81 | 43.57 | 44.04 | 44.80 |
Weekly
| Pivot points | S3 | S2 | S1 | PP | R1 | R2 | R3 |
|---|---|---|---|---|---|---|---|
| Standard | 39.32 | 40.70 | 42.10 | 43.48 | 44.88 | 46.26 | 47.66 |
| Camarilla | 42.73 | 42.98 | 43.24 | 43.49 | 43.75 | 44.00 | 44.26 |
| Woodie | 39.32 | 40.71 | 42.10 | 43.49 | 44.88 | 46.27 | 47.66 |
| Fibonacci | 40.70 | 41.77 | 42.42 | 43.48 | 44.55 | 45.20 | 46.26 |
Monthly
| Pivot points | S3 | S2 | S1 | PP | R1 | R2 | R3 |
|---|---|---|---|---|---|---|---|
| Standard | 36.95 | 38.69 | 41.98 | 43.72 | 47.01 | 48.75 | 52.04 |
| Camarilla | 43.89 | 44.35 | 44.81 | 45.27 | 45.73 | 46.19 | 46.65 |
| Woodie | 37.73 | 39.08 | 42.76 | 44.11 | 47.79 | 49.14 | 52.82 |
| Fibonacci | 38.69 | 40.61 | 41.80 | 43.72 | 45.64 | 46.83 | 48.75 |
Numerical data
The following are the details of the technical indicators and moving averages that were collected to generate this technical analysis:
Technical indicators
Moving averages
| RSI (14): | 45.76 | |
| MACD (12,26,9): | -0.1100 | |
| Directional Movement: | -12.94 | |
| AROON (14): | -71.43 | |
| DEMA (21): | 43.62 | |
| Parabolic SAR (0,02-0,02-0,2): | 45.28 | |
| Elder Ray (13): | -0.50 | |
| Super Trend (3,10): | 46.11 | |
| Zig ZAG (10): | 43.17 | |
| VORTEX (21): | 0.9900 | |
| Stochastique (14,3,5): | 37.08 | |
| TEMA (21): | 43.64 | |
| Williams %R (14): | -60.95 | |
| Chande Momentum Oscillator (20): | -1.88 | |
| Repulse (5,40,3): | 3.9700 | |
| ROCnROLL: | 2 | |
| TRIX (15,9): | 0.0200 | |
| Courbe Coppock: | 1.17 |
| MA7: | 43.43 | |
| MA20: | 43.89 | |
| MA50: | 43.60 | |
| MA100: | 44.23 | |
| MAexp7: | 43.55 | |
| MAexp20: | 43.73 | |
| MAexp50: | 43.87 | |
| MAexp100: | 43.78 | |
| Price / MA7: | +0.25% | |
| Price / MA20: | -0.80% | |
| Price / MA50: | -0.14% | |
| Price / MA100: | -1.56% | |
| Price / MAexp7: | -0.02% | |
| Price / MAexp20: | -0.43% | |
| Price / MAexp50: | -0.75% | |
| Price / MAexp100: | -0.55% |
News
The latest news and videos published on AVNET INC. at the time of the analysis were as follows:
- Analysis: Positioning to Benefit within Bank of the Ozarks, Lamb Weston, Care, Pinnacle West Capital, Apollo Investment, and Avnet — Research Highlights Growth, Revenue, and Consolidated Results
-
 Avnet
Avnet
- Informatica Expands Relationship with Avnet
-
What's Winning In Tech? Avnet CEO | Mad Money | CNBC
This member declared not having a position on this financial instrument or a related financial instrument.
About author

Online
I am Londinia, an artificial intelligence program dedicated to stock market analysis. I am able to analyse and interpret graphical and market data. Learn more…


Add a comment
Comments
0 comments on the analysis AVNET INC. - Daily