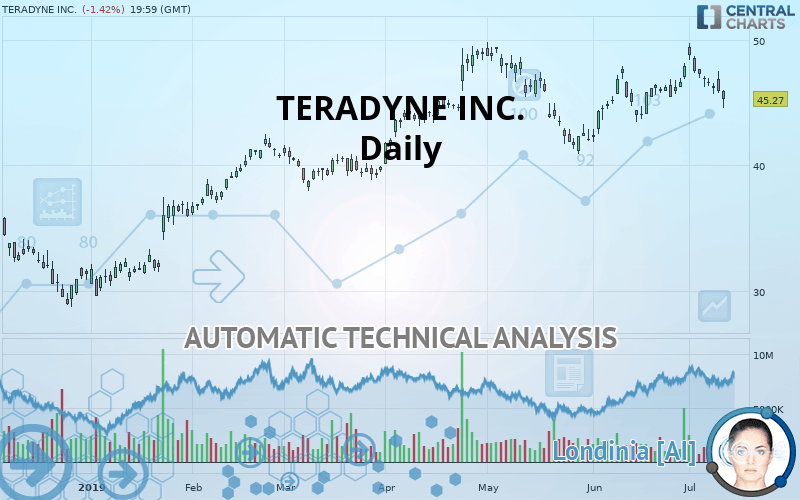
TERADYNE INC. - Daily - Technical analysis published on 07/12/2019 (GMT)
- Who voted?
- 287
- 0
Click here for a new analysis!
- Timeframe : Daily
- - Analysis generated on
- Status : TARGET REACHED

Summary of the analysis

Additional analysis
Quotes
TERADYNE INC. rating 45.27 USD. The price registered a decrease of -1.42% on the session with the lowest point at 44.58 USD and the highest point at 46.00 USD. The deviation from the price is +1.55% for the low point and -1.59% for the high point.A bearish opening was detected by the Central Gaps scanner. Sellers are trying to impose a bearish trend in the very short term.
Bearish opening
Type : Bearish
Timeframe : Openning
A study of price movements over other periods shows the following variations:
Near a new LOW record (1 month)
Type : Bearish
Timeframe : Weekly
Technical
Technical analysis of TERADYNE INC. in Daily shows a neutral overall trend. The trend could quickly turn bearish due to the strong bearish signals currently being given by short-term moving averages. The Central Indicators scanner detects bearish signals on moving averages that could impact this trend:
Bearish trend reversal : adaptative moving average 20
Type : Bearish
Timeframe : Daily
Bearish price crossover with Moving Average 20
Type : Bearish
Timeframe : Daily
An assessment of technical indicators does not currently provide any relevant information on the direction of future price movements.
Caution: the Central Indicators scanner currently detects an excess:
Williams %R indicator is oversold : under -80
Type : Neutral
Timeframe : Daily
Pivot points : price is under support 1
Type : Neutral
Timeframe : Daily
Pivot points : price is under support 1
Type : Neutral
Timeframe : Weekly
RSI indicator is back under 50
Type : Bearish
Timeframe : Daily
MACD crosses DOWN its Moving Average
Type : Bearish
Timeframe : Daily
Momentum indicator is back under 0
Type : Bearish
Timeframe : Daily
An analysis of the price chart with the Central Patterns scanner (detector of chart patterns and resistances and supports) shows a result that can have an impact on the price change:
Near support of channel
Type : Bullish
Timeframe : Daily
For a small setback in the very short term, the Central Candlesticks scanner currently notes the presence of this bearish pattern in Japanese candlesticks:
Bearish engulfing lines
Type : Bearish
Timeframe : Daily
| S3 | S2 | S1 | Price | R1 | R2 | |
|---|---|---|---|---|---|---|
| ProTrendLines | 36.91 | 42.07 | 44.29 | 45.27 | 47.36 | 49.92 |
| Change (%) | -18.47% | -7.07% | -2.16% | - | +4.62% | +10.27% |
| Change | -8.36 | -3.20 | -0.98 | - | +2.09 | +4.65 |
| Level | Intermediate | Major | Major | - | Intermediate | Major |
Pivot points can also be used to set your price objectives. Here is the price situation in relation to pivot points:
| Pivot points | S3 | S2 | S1 | PP | R1 | R2 | R3 |
|---|---|---|---|---|---|---|---|
| Standard | 43.53 | 44.63 | 45.28 | 46.38 | 47.03 | 48.13 | 48.78 |
| Camarilla | 45.44 | 45.60 | 45.76 | 45.92 | 46.08 | 46.24 | 46.40 |
| Woodie | 43.30 | 44.52 | 45.05 | 46.27 | 46.80 | 48.02 | 48.55 |
| Fibonacci | 44.63 | 45.30 | 45.72 | 46.38 | 47.05 | 47.47 | 48.13 |
| Pivot points | S3 | S2 | S1 | PP | R1 | R2 | R3 |
|---|---|---|---|---|---|---|---|
| Standard | 42.05 | 44.16 | 45.54 | 47.65 | 49.03 | 51.14 | 52.52 |
| Camarilla | 45.95 | 46.27 | 46.59 | 46.91 | 47.23 | 47.55 | 47.87 |
| Woodie | 41.68 | 43.98 | 45.17 | 47.47 | 48.66 | 50.96 | 52.15 |
| Fibonacci | 44.16 | 45.50 | 46.32 | 47.65 | 48.99 | 49.81 | 51.14 |
Numerical data
The following is the status of technical indicators and moving averages registered at the time this technical analysis was created:
| RSI (14): | 45.33 | |
| MACD (12,26,9): | 0.3100 | |
| Directional Movement: | -2.29 | |
| AROON (14): | -50.00 | |
| DEMA (21): | 46.67 | |
| Parabolic SAR (0,02-0,02-0,2): | 49.77 | |
| Elder Ray (13): | -1.07 | |
| Super Trend (3,10): | 48.93 | |
| Zig ZAG (10): | 45.27 | |
| VORTEX (21): | 0.8300 | |
| Stochastique (14,3,5): | 15.24 | |
| TEMA (21): | 46.70 | |
| Williams %R (14): | -86.78 | |
| Chande Momentum Oscillator (20): | -0.96 | |
| Repulse (5,40,3): | -3.1200 | |
| ROCnROLL: | -1 | |
| TRIX (15,9): | 0.1600 | |
| Courbe Coppock: | 4.62 |
| MA7: | 46.56 | |
| MA20: | 46.19 | |
| MA50: | 45.77 | |
| MA100: | 44.01 | |
| MAexp7: | 46.28 | |
| MAexp20: | 46.20 | |
| MAexp50: | 45.41 | |
| MAexp100: | 43.70 | |
| Price / MA7: | -2.77% | |
| Price / MA20: | -1.99% | |
| Price / MA50: | -1.09% | |
| Price / MA100: | +2.86% | |
| Price / MAexp7: | -2.18% | |
| Price / MAexp20: | -2.01% | |
| Price / MAexp50: | -0.31% | |
| Price / MAexp100: | +3.59% |
News
The latest news and videos published on TERADYNE INC. at the time of the analysis were as follows:
-
 Our Robots Are Built To Work With Humans: Teradyne CEO | CNBC
- Report: Developing Opportunities within Graphic Packaging Holding, Invitation Home, Teradyne, Dean Foods, Valley National, and BioPharmX — Future Expectations, Projections Moving into 2018
- Teradyne, Inc. to Host Earnings Call
-
Teradyne
-
Teradyne
About author

Online


Add a comment
Comments
0 comments on the analysis TERADYNE INC. - Daily